Download
1 / 28
280 likes | 328 Views
Explore the concepts of Mohr Stress Diagram in geology, stress equations, laboratory experiments, and problem-solving scenarios in rock deformation studies. Learn to analyze stress states, calculate normal and shear stresses, and interpret mean stress variations. Enhance your understanding of differential stress and its impact on rock behavior.

E N D
The Mohr Stress Diagram Edvard Munch as a young geologist
Material in the chapter is covered in Chapter 7 in Fossen’s text
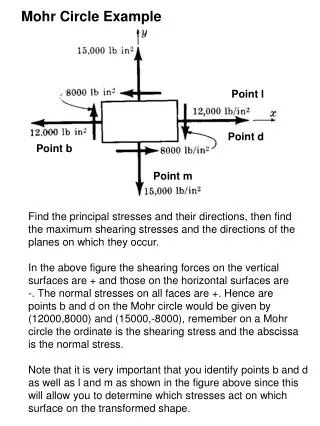
The Mohr Stress Diagram A means by which two stresses acting on a plane of known orientation can be plotted as the components of normal and shear stresses (derived separately from each of the two stresses). The Mohr circle is thus an elegant way to determine the shear and normal stresses for a pair of stresses oriented obliquely to the plane in question. The Mohr circle allows you to quickly read this for planes of any orientation. It also makes it easy to visualize mean stress and differences in stress, or deviatoric stress and relate these to deformation.
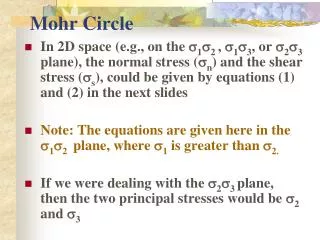
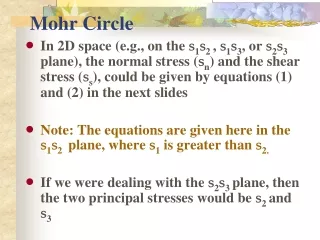
sn = (s1 + s3) + (s1 - s3) cos 2Q 2 2 ss = (s1 - s3) sin 2Q 2 Stress Equations Two perpendicular stresses oriented at any angle to a plane Normal Stress Shear Stress Theta is the angle between the maximum stress and the pole to the plane the stresses are acting upon.
sn = (s1 + s3) + (s1 - s3) cos 2Q 2 2 ss = (s1 - s3) sin 2Q 2 The Mohr Stress Diagram Theta = angle between The normal to the plane and the maximum principle stress (see Fig 4.1 in Fossen)
The Mohr Circle - (mean or average stress) Mean Stress
The Mohr Circle – radius or deviatoric stress Deviatoric Stress
The Mohr Circle – diameter or differential stress Differential Stress
Laboratory Experiments in Rock Deformation Deformed marble rock cylinders
Laboratory Experiments in Rock Deformation Stress a rock sample until it fractures (or flows)
In-class exercise, work in groups of 4, turn in write up of answers. Given these samples, discuss how the magnitude of stresses likely varied relative to one another in these four experiments. Each cylinder was deformed in a different experiment, each with its own axial and radial load (which varied relative to one another).
In-class problem • For maximum and minimum stresses of 600 and 200 mega-pascals (MPa) oriented as a vertical vector and a horizontal, E-W striking vector (respectively), determine the normal and shear stresses on a plane oriented North-South, 45 degrees East. It helps to first draw a block diagram. • So max stress is oriented vertically and equal to 600 MPA • Min stress is horizontal, oriented east-west and = 200 MPa
In-class problem There are two ways to solve these problems. Use the Mohr Stress Diagram or Use the equations (extra credit if you do both…)
Determine the normal and shear stresses on a plane oriented N-S, 45o E Maximum stress is oriented vertically and equal to 600 MPA Minimum stress is horizontal, oriented east-west and = 200 MPa Use the Mohr Stress Diagram
sn = (s1 + s3) + (s1 - s3) cos 2Q 2 2 ss = (s1 - s3) sin 2Q 2 For maximum and minimum stresses of 600 and 200 (MPa) oriented as a vertical vector and a horizontal, E-W striking vector (respectively), determine the normal and shear stresses on a plane oriented North-South, 45 degrees East. It helps to first draw a block diagram. Use the Equations For the minimum and maximum principle stresses of 600 and 200 megapascals (MPa) oriented as a vertical vector and a horizontal, E-W striking vector (respectively), determine the normal and shear stresses on a plane oriented North-South, 45 degrees East
For the stress state in the previous problem, determine the differential stress and mean stress. Start by plotting the solution for normal and shear stresses on the Mohr Stress Diagram. • Discuss how a change in differential stress might affect whether a rock might be more or less likely to break. It may help by arbitrarily varying the stresses and looking at how they plot on the circle, or by imagining stress on a cube. • Now discuss whether increasing the mean stress would cause a rock to break more readily. Would this be more or less likely with increasing depth in the crust? • Draw the stress state where the minimum and maximum stresses are both equal to 600 Mpa.
Following set of slides should be copied and handed out to students for exercises. Work in groups of 4, so for a class of 80 students, print out 20 sets.
In-class exercise, work in groups of 4 & turn in a write up of your answers. Problem 1.1 Given these samples, discuss how the mean stress likely varied relative to one another in these four samples. Each cylinder was deformed in a different experiment, each with its own axial and radial load (which varied relative to one another).
In-class problem 1.2 For maximum and minimum stresses of 600 and 200 mega-pascals (MPa) oriented as a vertical vector and a horizontal, E-W striking vector (respectively), determine the normal and shear stresses on a plane oriented North-South, 45 degrees East. It helps to first draw a cross section. So max stress is oriented vertically and equal to 600 MPA Min stress is horizontal, oriented east-west and = 200 MPa
sn = (s1 + s3) + (s1 - s3) cos 2Q 2 2 ss = (s1 - s3) sin 2Q 2 For maximum and minimum stresses of 600 and 200 megapascals (MPa) oriented as a vertical vector and a horizontal, E-W striking vector (respectively), determine the normal and shear stresses on a plane oriented North-South, 45 degrees East. It helps to first draw a cross section. Use the Equations
For the stress state in the previous problem, determine the differential stress and mean stress. Start by plotting the solution for normal and shear stresses for planes of all orientations on the Mohr Stress Diagram. Discuss how a change in differential stress might make the sample more or less likely to break. It may help by arbitrarily varying the stresses and looking at how they plot on the circle, or by imagining stress on a cube. Now discuss whether increasing just the mean stress would cause a rock to break more readily (i.e. not deviatoric or differential stress). Draw the stress state where the minimum and maximum stresses are both equal to 600 MPa. What is the differential stress? Would you expect the rock to deform under these conditions?
In-class problem 2.2 For the stress state in the previous problem, determine the differential stress and mean stress. Start by plotting the solution for normal and shear stresses for planes of all orientations on the Mohr Stress Diagram.
In-class problem 2.4 Discuss how a change in differential stress might make the sample more or less likely to break. It may help by arbitrarily varying the stresses and looking at how they plot on the circle, or by imagining stress on a cube.
In-class problem 2.5 Now discuss whether increasing the mean stress would cause a rock to break more readily (i.e. not deviatoric or differential stress).
In-class problem 2.6 Draw the stress state where the minimum and maximum stresses are both equal to 600 Mpa. What is the differential stress? Would you expect the rock to deform under these conditions?