Expectation
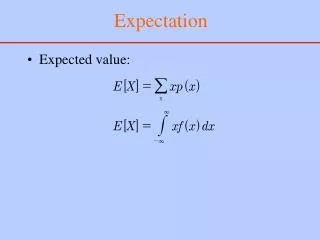
Expectation. Random Variables Graphs and Histograms Expected Value. Random Variables. A random variable is a rule that assigns a numerical value to each outcome of an experiment. We will classify random variables as either

Expectation
E N D
Presentation Transcript
Expectation Random Variables Graphs and Histograms Expected Value
Random Variables A random variable is a rule that assigns a numerical value to each outcome of an experiment. We will classify random variables as either • Finite discrete – if it can take on only finitely many possible values. • Infinite discrete – infinitely many values that can be arranged in a sequence. • Continuous – if its possible values form an entire interval of numbers
Example One Suppose that we toss a fair coin three times. Let the (finite discrete) random variable X denote the number of heads that occur in three tosses. Then
Example Two Suppose that we toss a coin repeatedly until a head occurs. Let the (infinite discrete) random variable Y denote the number of trials.
Example Three A biologist records the length of life (in hours) of a fruit fly. Let the (continuous) random variable Z denote the number of hours recorded. If we assume for simplicity, that time can be recorded with perfect accuracy, then the value of Z can take on any nonnegative real number.
Graphs and Histograms Given a random variable X, we will be interested in the probability that X takes on a particular real value x, symbolically we write pX(x) = P(X = x) pX(x) is referred to as the probability function of the random variableX.
Geometric Representation Consider Example Two where a coin is tossed three times. From the given table we see that p(0)= P(X= 0)= 1/8 p(1)= P(X= 1)= 3/8 p(2)= P(X= 2)= 3/8 p(3)= P(X= 3)= 1/8
Expectation • Arithmetic Mean • Consider 10 hypothetical test scores: 65, 90, 70, 65, 70, 90, 80, 65, 90, 90 • Calculate the mean as follows:
Expectation We may express the arithmetic mean as: As the number of repetition increases