Download
1 / 1
10 likes | 216 Views
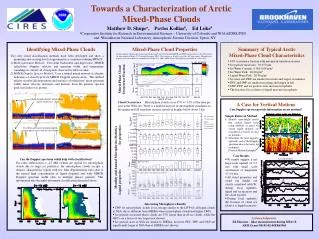
CloudSat. 1825 UTC on 05 Nov 2006 Aqua MODIS: Cloud top temperature CloudSat CPR cloud classification. 05 November 2006. 25 February 2007. MODIS Cloud Phase. MODIS Cloud Phase.

E N D
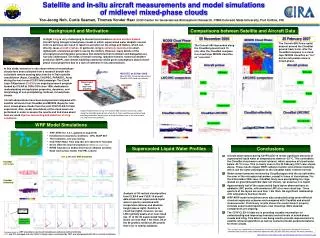
CloudSat 1825 UTC on 05 Nov 2006 Aqua MODIS: Cloud top temperature CloudSat CPR cloud classification 05 November 2006 25 February 2007 MODIS Cloud Phase MODIS Cloud Phase The Convair-580 flew a spiral descent around the CloudSat ground track 5 min. after the CloudSat overpass in a cloud layer MODIS classifies as “ice” but aircraft probes show is mixed-phase. The Convair-580 descended along the CloudSat ground track 15 min. after the CloudSat overpass in a cloud layer MODIS classifies as “uncertain.” Aircraft probes Aircraft probes Altitude Altitude LWC/IWC comparison LWC/IWC comparison LWC LWC Icing Icing Temperature Temperature CloudSat reflectivity CloudSat LWC/IWC CloudSat reflectivity CloudSat LWC/IWC Aircraft path Aircraft path Supercooled liquid layer from CALIPSO Convair-580 CloudSat LWC & IWC CloudSat Reflectivity WRF model simulations Temperatures observed from the aircraft Satellite and in-situ aircraft measurements and model simulations of midlevel mixed-phase clouds Yoo-Jeong Noh, Curtis Seaman, Thomas Vonder Haar (DoD Center for Geosciences/Atmospheric Research, CIRA/Colorado State University, Fort Collins, CO) Background and Motivation Comparisons between Satellite and Aircraft Data In-flighticing is very challenging to forecast and remains a serious aviation hazard. Aircraft flying through mixed-phase clouds in which supercooled water droplets coexist with ice particles can result in rapid ice accretion on the wings and frames, which can directly cause aircraft crashes. In particular, icing is extremely hazardous to small, lightweight, unmanned aircraft in use by the military. However, many details of the microphysical and dynamic processes that determine their formation and dissipation are not fully understood. The fields of remote sensing, radiative transfer, numerical weather prediction (NWP), and climate modeling commonly utilize gross assumptions about mixed-phase cloud properties due to a lack of extensive in situ observations. In this study, extensive in situ observations of mixed-phase clouds have been collected from a research aircraft with coincident remote sensing data from the A-Train satellite constellation (Aqua, CloudSat, CALIPSO, PARASOL, Aura) during the most recent CLEX field campaign. The Cloud Layer EXperiment (CLEX) is an ongoing research program funded by CG/AR at CIRA/CSU since 1996, dedicated to understanding microphysical properties, dynamics, and morphology of non-precipitating, midlevel, mixed-phase clouds. Aircraft observations have been analyzed and compared with satellite retrievals from CloudSat and MODIS (Aqua) for mid-level, mixed-phase clouds from the joint C3VP/CLEX-10 fieldexperiment. Also, model simulations of the cloud cases are performed in order to assess the results and find clues about how we could improve forecasting and detection of icing conditions. (above) Experimental set-up. The Convair-580 research aircraft was flown along the CloudSat ground track while the A-Train satellites passed overhead, providing coincident observations of icing conditions from in situ and remote sensing instrument platforms. WRF Model Simulations • WRF-ARW (Ver. 3.2.1, updated on Aug 2010) • Initialization & boundary conditions : GFS, NCEP SST • Three domains, one way nesting • Grid:199x139x32, Time step (dt): 20 s (d03) 36 hr forecasts • Seven different cloud microphysics (WSM6 not shown here) • RRTM long-wave & Dudhia short-wave radiation schemes • Noah land-surface model, YSU PBL scheme Supercooled Liquid Water Profiles Conclusions • Aircraft observations during C3VP/CLEX-10 reveal significant amounts of supercooled liquid water at temperatures down to -32 oC. This contradicts the CloudSat cloud water content retrieval, which assumes all cloud water below -20 oC is ice. This is clearly seen in the 25 February 2007 case shown above. These results impact NWP, radiative transfer and climate modeling, which use the same assumption as the CloudSat water content retrieval. • Water content amounts retrieved by CloudSat agree with the aircraft within the error of the microphysical probes, except in terms of cloud phase. For the 5 November 2006 case, CloudSat likely sees precipitating ice virga (based on ground based lidar data not shown), yet assumes it is liquid. • Approximately half of the supercooled liquid layers observed have an adiabatic LWC profile, with maximum LWC at or near cloud top. Three quarters of the layers are less than 1 km thick. No significant relationship with temperature has been found. • WRF-ARW model simulations were also conducted using seven different cloud microphysics schemes and compared with CloudSat and aircraft measurements. Preliminary results shows the model doesn’t properly simulate supercooled liquid layers near cloud top. More detailed comparisons are ongoing. • The C3VP/CLEX-10 data set is providing valuable information for understanding and improving forecasts and retrievals of mixed-phase clouds and icing. This data is now being used to provide improvements to satellite retrieval algorithms as well as numerical model parameterizations for these clouds. LWC & IWC from WRF simulations Analysis of 55 vertical cloud profiles from CLEX-9 and CLEX-10 aircraft data shows that supercooled liquid water is poorly correlated with temperature (above) and absolute height (above right). Relative to cloud top (right), however, we see LWC typically peaks at or near cloud top. 41 of the 55 supercooled liquid layers are less than 1 km thick. 29 of the 55 profiles exhibit a LWC profile that is (or is nearly) adiabatic. This research was supported by the Department of Defense Center for Geosciences/Atmopheric Research at Colorado State University under Cooperative Agreement W911NF-06-2-0015 with the Army Research Laboratory. • Comparisons of WRF simulations (six cloud microphysics schemes) with aircraft data • LWC and IWC averaged over the CLEX-10 target region, normalized by TWC, and interpolated with 500 m vertical resolutions Noh@cira.colostate.edu and Seaman@cira.colostate.edu