Download
1 / 22
220 likes | 317 Views
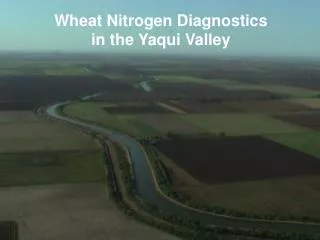
Climate Change in the Yaqui Valley David Battisti University of Washington. Climatological Annual Cycle Winter vs. Summer Variability(Winter) ENSO and Extreme Events Trends and Climate Change (wheat yield and climate) Puzzles. 1. The Annual Cycle. Summer

E N D
Climate Change in the Yaqui ValleyDavid BattistiUniversity of Washington • Climatological Annual Cycle • Winter vs. Summer • Variability(Winter) • ENSO and Extreme Events • Trends and Climate Change • (wheat yield and climate) • Puzzles
1. The Annual Cycle • Summer • Tropical storms, hurricane debris, (monsoon) • Winter • El Nino/Southern Oscillation (ENSO) • Pacific North American Pattern • More
2. Interannual Variability Precipitation Anomalies • Winter • El Nino/Southern Oscillation (ENSO) • Pacific North American Pattern • More • Summer • Not today • Extreme Events • Extended Drought (Lobell 2003)
Temperature Anomalies ENSO • ENSO warms offshore and cools to the east in the Sierra. • ENSO brings winter rainfall to the Yaqui Valley catchment basin (r = 0.55) Precipitation Anomalies (January-April)
Precipitaiton Anomalies (January-April) The Pacific North American (PNA) Pattern • The (+) PNA brings winter rainfall to the Yaqui Valley catchment basin (r=.6). • The (+) PNA warms offshore and cools to the east in the Sierra. • Yaqui Valley is on a nodal line for PNA -- no signal. Temperature Anomalies (January-April)
Temperature Anomalies (January-April) The West Pacific (WP) Pattern • The mechanisms for the year-to-year variability in this ‘new’ pattern of natural variability are not known. • The WP pattern does bring seasonal temperature and precipitation anomalies to the Yaqui Valley (warm/dry, cold/wet). Precipitation Anomalies (January-April)
The West Pacific (WP) Pattern (cont) Temperature Anomalies (January-April) • The WP pattern does bring seasonal temperature and precipitation anomalies to the Yaqui Valley (warm/dry, cold/wet; r=0.5/0.7). • The WP pattern is only weakly correlated to SST in the eastern Pacific.
Extreme Drought • The instrument record of Yaqui Valley basin precipitation has been extended using tree ring data. • Correlation of observed and reconstructed Nov-April rainfall is 0.77. Precipitation Anomalies (Nov-April) (Diaz et al. 2002)
Extreme Drought • The reconstructed precipitation record extends from 1650 to 1985 AD. • The average return time for a drought similar to the present drought is about 20 years. • Correlation of observed and reconstructed Jan-April rainfall is 0.77. Precipitation Anomalies (November-April)
3. Trends and Climate Change • Annual wheat yield in Yaqui Valley (1983-2002) is highly correlated to the Jan-April average minimum daily temperature. • Is this due to climate or management? • Note: much of the relationship between minimum temperature and yield is interannual (r =0.7) Yield Temp (Lobell et al. 2003)
Temperature Anomalies Yield and Climate • Increased yield is related to • Less precipitation (r = 0.8!) • Reduced minimum temperatures • Cold SST immediately offshore • Warm SST in the western Pacific • The PNA and the WP are weakly related to yield (r=-.31 and .42, respectively) Precipitation Anomalies (January-April)
4. Conclusions • Much of the variability in wintertime precipitation in the Yaqui Vally catchment is due to patterns of natural climate variability: ENSO, the PNA and the WP phenomenon. • The local ocean SST conditions are probably not influencing Tmin: • ENSO, remotely forced atmospheric teleconnections (WP) and variability intrinsic to the atmosphere (PNA) are likely to be responsible. • Some of the relationship between yield and climate could be explained by the collection of natural patterns of interannual variability: • The PNA and the WP are weakly related to yield (r =-.31 and .42, respectively) • Another Pattern is worth checking: the North Pacific pattern.
4. Conclusions Warm Pool(WP) Index • The trend (20 year) in yield and minimum temperature are correlated with the 40 year (warming) trend in the western Pacific (WP). • The latter has been argued in several studies to be due to increasing greenhouse gas concentrations (e.g., Hoerling et al. 2003)
4. Conclusions and Puzzles • Problems: If the variability and trend in wheat yield are due to the natural variability in the PNA and WP (and the trend in WP), …. How do drier conditions (r=.7) lead to lower minimum daily temperatures? Does clearing lead to a greater diurnal temperature range, and hence a lower minimum daily temperature, even though the daily mean temperature might be rising? • Summer vs. winter precipitation and reservoir levels
ENSO Forecast Forecast Made Sept 2003 Operational forecasts of ENSO from the Univ. of Washington Skill: Forecasts from April Skill: Forecasts for August
4. Conclusions and Puzzles • Problems: If the variability and trend in wheat yield are due to the natural variability in the PNA and WP (and the trend in WP), …. • How do drier conditions (r=.7) lead to lower minimum daily temperatures? Does clearing lead to a greater diurnal temperature range, and hence a lower minimum daily temperature, even though the daily mean temperature might be rising?