Download
1 / 43
430 likes | 572 Views
6. Statistical Inference: Significance Tests. Goal: Use statistical methods to test hypotheses such as “For treating anorexia, cognitive behavioral and family therapies have same mean weight change as placebo” ( no effect)

E N D
6. Statistical Inference: Significance Tests Goal: Use statistical methods to test hypotheses such as “For treating anorexia, cognitive behavioral and family therapies have same mean weight change as placebo” (no effect) “Mental health tends to be better at higher levels of socioeconomic status (SES)” (i.e., there is an effect) “Spending money on other people has a more positive impact on happiness than spending money on oneself.”
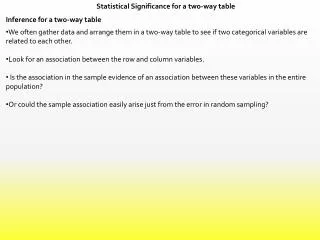
Hypotheses: For statistical inference, these are predictions about a population expressed in terms of parameters (e.g., population means or proportions or correlations) for the variables considered in a study A significance test uses data to evaluate a hypothesis by comparing sample point estimates of parameters to values predicted by the hypothesis. We answer a question such as, “If the hypothesis were true, would it be unlikely to get data such as we obtained?”
Five Parts of a Significance Test • Assumptions about type of data (quantitative, categorical), sampling method (random), population distribution (e.g., normal, binary), sample size (large enough?) • Hypotheses: Null hypothesis (H0): A statement that parameter(s) take specific value(s) (Usually: “no effect”) Alternative hypothesis (Ha): states that parameter value(s) falls in some alternative range of values (an “effect”)
Test Statistic: Compares data to what null hypo. H0 predicts, often by finding the number of standard errors between sample point estimate and H0 value of parameter • P-value (P): A probability measure of evidence about H0. The probability (under presumption that H0 true) the test statistic equals observed value or value even more extreme in direction predicted by Ha. • The smaller the P-value, the stronger the evidence against H0. • Conclusion: • If no decision needed, report and interpret P-value • If decision needed, select a cutoff point (such as 0.05 or 0.01) and reject H0 if P-value ≤ that value
The most widely accepted cutoff point is 0.05, and the test is said to be “significant at the .05 level” if the P-value ≤ 0.05. • If the P-value is not sufficiently small, we fail to reject H0 (then, H0 is not necessarily true, but it is plausible) • Process is analogous to American judicial system • H0: Defendant is innocent • Ha: Defendant is guilty
Significance Test for Mean • Assumptions: Randomization, quantitative variable, normal population distribution (robustness?) • Null Hypothesis: H0: µ = µ0 where µ0 is particular value for population mean (typically “no effect” or “no change” from a standard) • Alternative Hypothesis: Ha: µ µ0 2-sided alternative includes both > and < H0 value • Test Statistic: The number of standard errors that the sample mean falls from the H0 value
When H0 is true, the sampling dist of the t test statistic is the t distribution with df = n - 1. • P-value: Under presumption that H0 true, probability the t test statistic equals observed value or even more extreme (i.e., larger in absolute value), providing stronger evidence against H0 • This is a two-tail probability, for the two-sided Ha • Conclusion: Report and interpret P-value. If needed, make decision about H0
Example: Anorexia study (revisited) • Weight measured before and after period of treatment with “family therapy” • y = weight change (end – beginning) • In previous chapter, we found CI for population mean of y based on n=17 girls, with data y = 11.4, 11.0, 5.5, 9.4, 13.6, -2.9, -0.1, 7.4, 21.5, -5.3, -3.8, 13.4, 13.1, 9.0, 3.9, 5.7, 10.7
Is there evidence that family therapy has an effect? • Let µ = population mean weight change • Test H0: µ = 0 (no effect) against Ha: µ 0. • Data have --------------------------------------------------------------------------------------- Variable N Mean Std.Dev. Std. Error Mean weight_change 17 7.265 7.157 1.736 ---------------------------------------------------------------------------------------- Note that se is same as in CI for population mean:
P-Value: P = 2P(t > 4.18) = 0.0007 (from software) • Test Statistic(df = 16): • Interpretation: If H0were true, prob. would = 0.0007 of getting sample mean at least 4.18 standard errors from null value of 0. • Conclusion: Very strong evidence that the population mean differs from 0. (Specifically, it seems that µ > 0, as also suggested by 95% CI of (3.6, 10.9) we found in Chap. 5 notes) • Note: t table (Table B, p. 593) tells us P(t > 3.686) = 0.001, so test statistic t = 3.686 (or -3.686) would have P-value = 0.002 • (So, based on this table, we know that P-value < 0.002.)
SPSS output One-Sample Statistics N Mean Std. Deviation Std. Error Mean weight_change 17 7.265 7.1574 1.7359 One-Sample Test Test Value = 0 t df Sig. (2-tailed) Mean Difference 95% Confidence Interval of the Difference Lower Upper weight_change 4.185 16 .001 7.2647 3.58 10.945 (Note .001 is 0.0007 rounded to 3 decimal places. Click on “cell properties” if you want more decimal places.)
Equivalence between result of significance test and result of CI • When P-value ≤ 0.05 in two-sided test, 95% CI for µ does not contain H0 value of µ (such as 0) Example: P = 0.0007, 95% CI was (3.6, 10.9) • When P-value > 0.05 in two-sided test, 95% CI necessarily containsH0 value of µ • CI has more information about actual value of µ
Example: Suppose sample mean = 7.265, s = 7.16, but based on n = 4 (instead of n = 17) Then, Now, df = 3. This t statistic has two-sided P-value = 0.14. Not very strong evidence against null hypothesis of “no effect.” It is plausible that µ = 0. Margin of error = 3.182(3.58) = 11.4, and 95% CI is (-4.1, 18.7), which contains 0 (in agreement with test result)
One-sided test about mean Example: If study predicts family therapy has positive effect, could use Ha:µ > 0 Data support this hypothesis if t far out in right tail, so P-value = right-tail probability • Suppose t = 2.0 for n = 4 (df = 3), as on previous page P-value: P = P(t > 2.0) = 0.07 • For Ha:µ < 0, P-value = left-tail probability P-value: P = P(t < 2.0) = 0.93 In practice, two-sided tests are more common
Making a decision: The -level is a fixed number, also called the significance level, such that if P-value ≤ , we “reject H0”IfP-value > , we “do not reject H0”Note: We say “Do not reject H0” rather than “Accept H0” because H0 value is only one of many plausible values.Example (n = 4, two-sided): Suppose = 0.05. Since P-value = 0.14, we do not reject H0 . But 0 is only one of a range of plausible values exhibited in 95% CI of (-4.1, 18.7).
Effect of sample size on tests • With large n (say, n > 30), assumption of normal population distribution not important because of Central Limit Theorem. • For small n, the two-sided t test is robust against violations of that assumption. However, one-sided test is not robust. • For a given observed sample mean and standard deviation, the larger the sample size n, the larger the test statistic (because se in denominator is smaller) and the smaller the P-value. (i.e., we have more evidence with more data) • We’re more likely to reject a false H0 when we have a larger sample size (the test then has more “power”) • With large n, “statistical significance” not the same as “practical significance.”
Example: Suppose anorexia study for weight change had 95% CI is 1.0 ± 1.96(0.1), or (0.8, 1.2). This shows there is a positive effect, but it is very smallin practical terms. (There is statisticalsignificance, but not practicalsignificance.)
Significance Test for a Proportion • Assumptions: • Categorical variable • Randomization • Large sample (but two-sided ok for nearly all n) • Hypotheses: • Null hypothesis: H0: p= p0 • Alternative hypothesis: Ha: p p0 (2-sided) • Ha: p> p0 Ha: p< p0 (1-sided) • Set up hypotheses before getting the data
Test statistic: Note As in test for mean, test statistic has form (estimate of parameter – H0 value)/(standard error) = no. of standard errors the estimate falls from H0 value • P-value: Ha: p p0 P = 2-tail prob. from standard normal dist. Ha: p> p0 P = right-tail prob. from standard normal dist. Ha: p < p0 P = left-tail prob. from standard normal dist. • Conclusion: As in test for mean (e.g., reject H0 if P-value ≤ )
Example: Can dogs smell bladder cancer? (British Medical Journal, 2004) • Each trial, one bladder cancer urine sample placed among six control urine samples • Do dogs make the correct selection better than with random guessing? Let = probability of correct guess, for particular trial H0: = 1/7 (= 0.143, no effect), Ha: > 1/7 • In 54 trials, dogs made correct selection 22 times. Sample proportion = 22/54 = 0.407
Standard error Test statistic z = (sample – null)/se0 = [0.407 – (1/7)]/0.0476 = 5.6 P-value = right-tail probability from standard normal = 0.00000001 There is extremely strong evidence that dogs’ selections are better than random guessing (for the conceptual population this sample represents) For standard cut-off such as 0.05, we reject H0 and conclude that > 1/7.
Caveat: As in most medical studies, subjects were a convenience sample. We can not realistically randomly sample bladder cancer patients or dogs for the experiment. Even though samples not random, important to employ randomization in experiment, in placement of bladder cancer patient’s urine specimen among the 6 control specimens.
Decisions in Tests • a-level (significance level): Pre-specified “hurdle” for which one rejects H0 if the P-value falls below it (Typically 0.05 or 0.01) • Rejection Region: Values of the test statistic for which we reject the null hypothesis • For 2-sided tests with a = 0.05, we reject H0 if |z| 1.96
Error Types • Type I Error: Reject H0 when it is true • Type II Error: Do not reject H0 when it is false
P(Type I error) • Suppose a-level = 0.05. Then, P(Type I error) = P(reject null, given it is true) = P(|z| > 1.96) = 0.05 • i.e., the -level is the P(Type I error). • Since we “give benefit of doubt to null” in doing test, it’s traditional to take small, usually 0.05 but 0.01 to be very cautious not to reject null when it may be true. • As in CIs, don’t make too small, since as goes down, = P(Type II error) goes up (Think of analogy with courtroom trial) • Better to report P-value than merely whether reject H0 (Are P = 0.049 and 0.051 really substantively different?) See homework exercise 6.24 in Chapter 6
P(Type II error) • P(Type II error) = b depends on the true value of the parameter (from the range of values in Ha ). • The farther the true parameter value falls from the null value, the easier it is to reject null, and P(Type II error) goes down. (see graph of null and alternative dist’s) • Power of test = 1 - = P(reject null, given it is false) • In practice, you want a large enough n for your study so that P(Type II error) is small for the size of effect you expect.
Example: Testing new treatment for anorexia For a new treatment, we expect mean weight change = about 10 pounds, with std. dev. about 10. If our study will have n = 20, what is P(Type II error) if we plan to test H0: µ = 0 against Ha: µ > 0, using = 0.05? • We fail to reject H0: µ = 0 if we get P-value > 0.05 • We get P-value = 0.05 if test statistic t = 1.729 (i.e., with df = 19, 0.05 is right-tail prob. above 1.729, so “rejection region” is values of t > 1.729. We “fail to reject H0” if t < 1.729) • With n = 20, we expect a standard error of about
We get t = 1.729 if the sample mean is about 1.729(2.24) = 3.87. i.e., t = (3.87 – 0)/2.24 = 1.729. • So, we’ll get t < 1.729 and P-value > 0.05 (and make a Type II error) if the sample mean < 3.87. • But, if actually µ = 10, a sample mean of 3.87 is about (3.87 – 10)/2.24 = -2.74 standard errors from µ (i.e., 2.74 std. errors below µ = 10) • When df = 19, the probability falling at least 2.74 standard errors below the mean is about 0.007. So, there’s little chance of making a Type II error. • But what if µ actually is only 5? (exercise; > 0.007 or < 0.007?)
Limitations of significance tests • Statistical significance does not mean practical significance(Recall example on p. 17 of these notes) • Significance tests don’t tell us about the size of the effect (like a CI does) • Some tests may be “statistically significant” just by chance (and some journals only report “significant” results!)
Example: Are many medical “discoveries” actually Type I errors? Reality: Most medical studies are “non-significant,” not finding an effect. In medical research, when effects exist but are not strong, they may not be detected with the sample size (not very large) that is practical for many studies. (A British Medical Journal article in 2001 estimated that when an effect truly exists, P(Type II error) = 0.50!) Suppose an effect actually exists 8% of the time. Could a substantial percentage of medical “discoveries” (i.e., significant results) actually be Type I errors?
A tree diagram shows what we’d expect to happen with many studies (say, 1000) True Decision effect? Reject null? Yes (40) Yes (80) ---------------| | No (40) 1000 studies---| | Yes (46 = .05 x 920) No (920) ----------------| No (874) Of studies with rejected null hypotheses, Type I error rate = 46/(46+40) = 0.53!
Moral of the story: Be skeptical when you hear reports of new medical advances. There may be no actual effect (i.e. the entire study may merely be a Type I error.) If an effect does exist, we may be seeing a sample outcome in right-hand tail of sampling distribution of possible sample effects, and the actual effect may be much weaker than reported. (picture of what I mean by this)
Actual case: A 1993 statistically significant study estimated that injections of magnesium could double the chance of surviving a major heart attack. A much larger later study of 58,000 heart attack patients found no effect at all.
Figure from Agresti and Franklin, Statistics: The Art and Science of Learning from Data (p. 468)
The binomial distribution If • Each observation is binary (one of two categories) • Probabilities for each observation for category 1 1 - for category 2 • Observations are independent then for n observations, the number x in category 1 has This can be used to conduct tests about when n is too small to rely on large-sample methods (e.g., when expected no. observations in either category < about 10)
Example: Exercise 6.33 (ESP) • Person claims to be able to guess outcome of coin flip in another room correctly more often than not • = probability of correct guess (for any one flip) • H0: = 0.50 (random guessing) • Ha: > 0.50 (better than random guessing) • Experiment: n = 5 trials, x = 4 correct. Find the P-value, and interpret it. (Can’t treat sample proportion as having a normal dist. Expected counts are 5(0.50) = 2.5 correct, 2.5 incorrect, which are less than 10; need n = 20or higher to apply CLT)
For Ha : > 0.50, P-value is probability of observed result or result even more extreme in right-hand tail = P(4) + P(5) = 6/32 = 0.19 There is not much evidence to support the claim. We’d need to observe x = 5 in n = 5 trials to reject null at 0.05 level (Then, P-value = 1/32 < 0.05)
Notes about binomial distribution • Binomial is the most important probability distribution for categorical data (multinomial extension for many categories) • Can use binomial to find prob’s for examples in Chap. 4 where we constructed sampling dist’s, such as for number (or prop.) who support legal same-sex marriage out of n = 4 sampled • Binomial dist for x = number in category 1 has whereas sample proportion = x/n has
Example: Poll results for proportion with n = 1000, = 0.50 • x = number in category of interest has • proportion in category of interest has Effect of n? As n increases, spread of distribution goes up for number, spread goes down for proportion (law of large numbers). More bell-shaped as n increases. Graphs: p. 171
Review significance test questions Do a minority of Americans believe that same-sex marriage should be legal? Which is the appropriate alternative hypothesis? a. Ha : = 0.50 b. Ha : < 0.50 c. Ha : > 0.00 d. Ha : < 0.50 e. Ha : 0.50
What happens to P(Type II error) • when you decrease the P(Type I error) from 0.05 to 0.01 for making the decision? • when the actual population proportion gets closer to the null hypothesis value? • Decreases • Increases • Stays the same
Let’s practice with one more problem (optional HW exercise 6.21) Multiple-choice question, 4 choices. Test whether the probability of a correct answer is higher than expected just due to chance (with random guessing of answer). • Set up hypotheses. • For 400 students, 125 get correct answer. Find P-value and interpret. (answer: P = 0.002)