The Urban Atmosphere Research Program
230 likes | 307 Views
The Urban Atmosphere Research Program Focus – To take our forecasts and analyses to where people live and work. Issues -- For forecasting: Dispersion Floods Fronts Heat waves Cold spells Icing Fires Air Quality For data acquisition and analysis:

The Urban Atmosphere Research Program
E N D
Presentation Transcript
The Urban Atmosphere Research Program Focus – To take our forecasts and analyses to where people live and work. Issues -- For forecasting: Dispersion Floods Fronts Heat waves Cold spells Icing Fires Air Quality For data acquisition and analysis: Climate Ecosystem loading Data requirements are different for the various issues. A central requirement is for an improved capability to predict the surface boundary layer accurately, and for data to support it.
Forecasting extreme weather– the probability of experiencing hazardous heat waves, extreme cold spells, icing and frontal passage (a linkage with the USWRP). • For flooding – taking the spatial variability of precipitation into proper account. • For air quality – the probability of exceeding potentially dangerous levels, e.g. of ozone and particulate matter (c.f. EPA/NOAA air quality forecasting). • For dispersion – the probability that people will be harmed by releases directly into the local atmosphere. • For urban fires – local wind behavior, with an emphasis on gustiness (and precipitation, of course) • We need to learn how to forecast, using local data as guidance. We need to be providing information that can be used. We need to avoid raising false alarms. • A sobering realization– more consideration of the surface is required than for weather forecasting, and there are relatively few field studies.
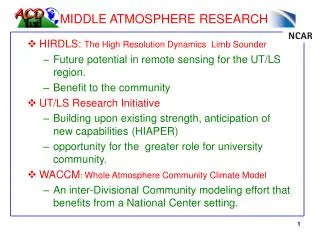
At the Multi-Agency level -- the evolving Urban Test Bed Research Program (building upon the OFCM “Challenges in Urban Meteorology” conference, September 2004.) The scientists already talk; the agencies are starting – DHS DOE DTRA Army EPA DOI Main areas receiving attention – Washington, DC New York (Las Vegas?) Oklahoma City Salt Lake City Principal groups involved – National Laboratories (ANL, PNL, LLBL, LLNL, BNL, ORNL, Sandia) NOAA (NWS, NOS, ARL, ESRL NSSL); EPA (NERL) Academic linkages – So far, through individual university contacts, the AMS and the International Association for Urban Climate
Street canyons present great difficulty. What should we predict -- [C] or P([C] > [C0])? “Skimming flow” is driven by the meteorology aloft. The in-canopy environment is controlled by the configuration of streets and buildings, traffic patterns, etc. Washington, DC, and New York illustrate two extremes • Washington has broad streets and low buildings. • New York has deep and sometimes narrow street canyons. Physical models and computational fluid dynamics models are being used, in parallel.
http://dcnet.atdd.noaa.gov/ A vision for measurements -- The proposed UrbaNet configuration Tier 1 -- Surface towers 1a Conventional meteorological systems 1b Enhanced systems 1c Specialized systems Tier 2 – Remote sensing (RADAR, etc.) Rooftop Towers (1c) U RADAR LIDAR (2) Avg. bldg height T T T T Surface Towers (1a, 1b) “UrbaNet” is DCNet in other areas (Tier 1c).
Some challenges for NOAA – 1. Accept the dominant mission given to us – to provide forecasts to protect life, property and the environment, related to the atmosphere and the oceans. This includes forecasts of dispersion. 2. Take forecasts to where the predictions affect people, where they live and work. Go probabilistic? 3. Emphasize areas where people and the environment are at risk – cities, industrial areas, ports, entertainment areas, etc. Hard reality check #1 Meteorological models are constructed from the understanding of processes, each of which is represented as an average behavior. If the models are essentially built from understanding of averages, they should not be expected to apply except on the average. We are no longer interested solely in the average. We need to address specific instances. Hence, the requirement for more data is extreme.
Hard reality check #2 – Meteorological models are becoming increasingly refined. However in daytime the convective process in the boundary layer is largely stochastic and hence deterministic models should not be expected to reproduce behaviors on the scale of convective updrafts, except on the average. Hence, conventional mesoscale models should not agree well with observations taken over scales that are less than several kilometers, unless these observations are ensemble-averaged. Hard reality check #3 – In theory and in practice, micrometeorological descriptions of the surface apply above about ten times the roughness length (several m) above the zero plane (~ 80% of the average structure height). Typically – RADAR cannot look low enough, and towers are not high enough. One Modeler’s response: Model output often agree well with observations. This is because models have been calibrated to the observations. However, Large ensemble effort underway to quantify uncertainties from the schochastic and other poorly represented processes.
NOAA Modeling Applications • Provide representation of the skimming flow • Incorporate urban scale parameterizations in mesoscale models • Focused evaluation of NWS non-hydrostatic model forecasts (~4 km) with urban datasets • Provide high resolution meteorological uncertainties using ensemble techniques • Explore mesoscale data assimilation techniques with urban datasets
The NMM-WRF Modeling System • Regional-Scale, Moving Multiple Nest, Atmospheric Modeling System. • Non-Hydrostatic system of equations formulatedon arotatedlatitude-longitude,Arakawa E-grid and a vertical, pressure hybrid (sigma_p-P) coordinate. • Designed for 1-10 km horizontal resolution scales • Runs operationally at NCEP for: • Daily High Resolution Window cycles • Special Fire Weather nests • Homeland Security Nests • 2005 inauguration, 2006 Torino Olympics
Salient Features: Telescopic E-Grid • Large Scale portion of the flow may be easily separated from the small scale structure which may be advantageous for Hurricane analysis. • However, as pointed out by Zhang et al.(1986; MWR), for the sake of smooth solutions across the interfaces it may be necessary to sacrifice mass and energy conservation across the interface in this approach. Nevertheless, for short-term numerical forecasts in which the use of appropriate model physics and the patterns to be forecast may be important than exact mass and energy conservation, as long as the mass (or energy) discrepancy at the interface is small. Courtesy of Gopalakrishnam, EMC
Real-Time Mesoscale Analysis(Geoff DiMego, EMC) The RTMA is a fast-track, proof-of-concept effort intended to: • leverage and enhance existing analysis capabilities in order to generate experimental CONUS-scale hourly NDFD-matching analyses • OPERATIONAL at NCEP and on AWIPS with OB7 by end of FY2006 • establish a real-time process that delivers a sub-set of fields to allow preliminary comparisons to NDFD forecast grids • Hourly temp, wind, moisture plus precip & sky on 5 km NDFD grid • also provide estimates of analysis uncertainty • establish benchmark for future AOR efforts • build constituency for subsequent AOR development activities
RTMA Procedure • Temperature & dew point at 2 m & wind at 10 m • RUC forecast/analysis (13 km) is downscaled by FSL to 5 km NDFD grid • Downscaled RUC used as first-guess in NCEP’s 2DVar analysis of ALL surface observations • Estimate of analysis error/uncertainty • Precipitation – NCEP Stage II analysis • Sky cover – NESDIS GOES sounder effective cloud amount
RTMA Logistics • Hourly within ~30 minutes • 5 km NDFD grid in GRIB2 • Operational at NCEP Q3 FY2006 • Distribution of analyses and estimate of analysis error/uncertainty via AWIPS SBN as part of OB7 upgrade – end of FY2006 • Archived at NCDC
Summary • Urban mesonets can be useful now for: • Development and evaluation of urban parameterizations in mesoscale models • Assimilation into real-time mesoscale analyses and into high resolution nested modeling • Quantify uncertainties from ensemble predictions systems (eg: JEFS, SREF, other HR ensemble)
Hard reality check #4 – People live within the surface “canopy” of trees and buildings, where the mesoscale models will not apply except on the average, and where local data are highly influenced by the local distribution of roughness elements and/or obstacles. We need to learn how to forecast for the canopy boundary layer, below the height at which the mesoscale models apply. Hard reality check #5 – There are plenty of data available, from instruments erected within the canopy – by transportation departments, environmental agencies, private companies, for example. These are usually situated within the canopy layer. Their data are not likely to be of use in the context of conventional mesoscale models, but it is not these conventional models that are appropriate for the mission at hand. Hence, we must learn how to extract relevant data from the large number of observations now available.
Hard reality check #6 – Date from within the area of interest are not sufficient, by themselves. There needs to be supporting information from the surrounding area, mostly upwind. Hard reality check #7 – We must re-think the issue of data acceptability. Synopticians emphasize representativeness, so that their models and the data have a chance of converging. They insist (correctly) on data well above the canopy, and not influenced by local obstacles. The present application emphasizes the need for data indicative of conditions within the canopy. We need data that are accurate representations of conditions where the instrumentation is situated. We need to think in terms of micrometeorological data quality control, not data quality assurance as designed for weather forecasting purposes. Q1: Is the instrumentation reporting what it experiences? Q2: Is the data stream useful?
Rethink tower data acceptability: • There are two main questions. Are the data correct, and are they useful? Correctness is essentially a Point of Origin question. • Conduct Point of Origin data assurance, • -- Perform scheduled calibrations. • -- Search for data drop-outs. • -- Inspect the continuous data record and search for periods of constant output (indicative of sensor failure and/or intermittency) • -- Report at every reporting interval the statistics generated from the raw data: • Averages and standard deviations • Proportion of time with unchanging output from sensor
Data Usefulness is a Point of Application question. • 2. Conduct Point of Application data utility tests, • -- Apply such data quality criteria as may be relevant for the specific • application. • Scrupulously avoid rejecting data because they fail to meet the requirements of a different application. • -- Perform tests as needed to demonstrate forecasting improvements if the data are used. • -- Interface with the data network authorities to optimize the data collection/transfer/utilization processes. • -- Subject unwelcome critics to such torture as might be intellectually satisfying.
Some relevant heresies: Instead of nudging forecasts with a few observations, why not rely on nowcasts and adjust these according to predicted changes? I.e. Start with the best depiction of current reality, and construct expectations using the current situation as the foundation. The vision – synopticians will forecast skimming flow, local experts will refine forecasts to fit local situations. Remember – Meteorology is still somewhat an art. Like all artists, meteorologists tend to fall in love with their models.