Linear & Quadratic Functions
120 likes | 467 Views
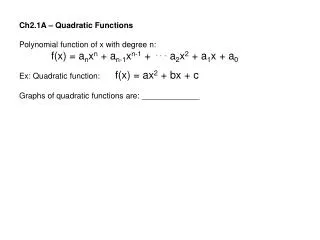
Linear & Quadratic Functions. PPT 2.1.1. What is a function?. In order for a relation to be a function, for every input value, there can only be one output value. To test to see if the relation is a function, we perform the vertical line test .

Linear & Quadratic Functions
E N D
Presentation Transcript
Linear & Quadratic Functions PPT 2.1.1
What is a function? In order for a relation to be a function, for every input value, there can only be one output value. To test to see if the relation is a function, we perform the vertical line test.
Thinking??? How would you change the graphs so that they were not functions? Vertical Line Test If a vertical line were to go through a graph, would it cross through the graph more than once at any spot? Click your mouse and watch the vertical line go through the linear graph and then do it again to go through the parabola. Since the vertical line only crosses each graph once, each one is considered to be a function. Every input value (x) has only one output value (y).
Not a Function The graph above is clearly not a function since the vertical line crosses the graph more than once. Every input value (x) has two output values (y) except for one. Which one?
Linear Functions Recall from your previous math classes that linear functions can be written in the following way: y = mx + b where m is the slope of the line and b is the y-intercept of the line If m is positive, the line climbs from left to right. If m is negative, the line falls from left to right. The value of m, would be considered the leading coefficient of a linear function. In future lessons, we will be using a to represent the leading coefficient for all polynomial functions. The leading coefficient is the coefficient of the first term in a polynomial in descending order by degree (value of exponents).
Domain and Range Domain: is the set of x-values (or input values) that exist within the graph or the equation of a function. Range: is the set of y-values (or output values) that exist within the graph or the equation of a function.
Domain and Range ofLinear Functions Most linear functions will have the same domain and range as the example but not all. What type of linear functions would have a different domain and/or range? HORIZONTAL! A horizontal line will have the same domain but its range will be just a single number. The y-value of all the points on the line. Let’s look at the domain of this function. The value of x can be a very large positive or negative number and anything in between. If x is not restricted in any way, we define the domain in the following manner: Domain: All real numbers or {x| x Є R} Now let’s look at the range. In the same way, the value of y can be a very large positive or negative number and anything in between. If y is not restricted in any way, we define the range in the following manner: Range: All real numbers or {y| y Є R}
Is it possible to draw a straight line with the following end behaviour: As x , y - and as x -, y -? End Behaviour of Linear Functions When we discuss end behaviour, we are looking at what happens to the y-values as x approaches positive infinity () and negative infinity (-), the ends of the function. Let’s look at our example. As x approaches infinity (imagine travelling to the right on the line), what happens to values of y? They get larger or we can say that they approach infinity. As x approaches negative infinity (imagine travelling to the left on the line), what happens to values of y? They get smaller or we can say that they approach negative infinity. We summarize the end behaviour in this manner: As x , y and as x -, y -.
Describe the parabola that has domain {x| x ЄR} and range {y| y10, y ЄR}. Domain and Range ofQuadratic Functions Let’s consider the domain. Since our graph is not restricted (we could see very large positive and negative numbers and everything in between), the domain is: All real numbers or {x| x ЄR}. The value of y, however, is restricted. The y-values will not get lower than -5. Since our y-values are restricted, the range is: All real numbers greater than and including -5 or {y| y≥-5, y ЄR}.
End Behaviour ofQuadratic Functions Let’s now look at the end behaviour of the parabola. As x approaches infinity (imagine travelling to the right on the parabola), what happens to values of y? They get larger or we can say that they approach infinity. As x approaches negative infinity (imagine travelling to the left on the parbola), what happens to values of y? They get larger again or we can say that they approach infinity. We summarize the end behaviour in this manner: As x , y and as x -, y .
X - Intercepts The x-intercept is 4. The x-intercepts are 3 and -3. An x-intercept is the x-value where the graph crosses the x-axis.
Quadratic Functions and X-Intercepts This parabola has two x-intercepts. This parabola has no x-intercepts. This parabola has one x-intercept.