Download
1 / 1
10 likes | 137 Views
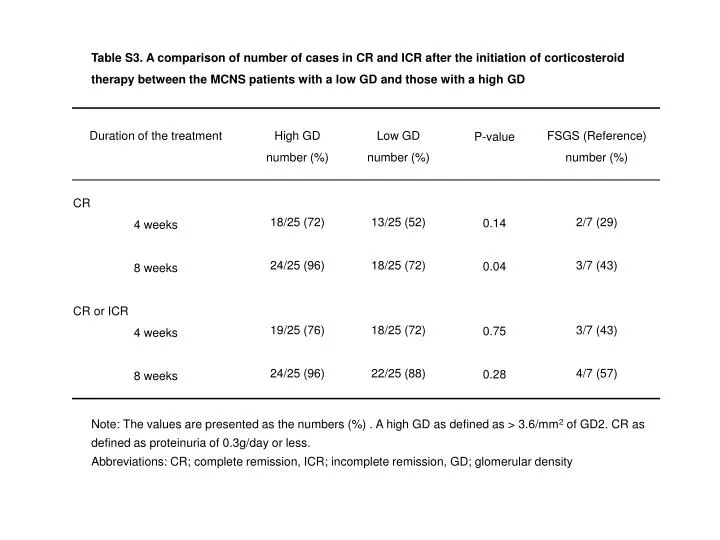
Table S3. A comparison of number of cases in CR and ICR after the initiation of corticosteroid therapy between the MCNS patients with a low GD and those with a high GD. Duration of the treatment CR 4 weeks 8 weeks CR or ICR 4 weeks 8 weeks. High GD number (%) 18/25 (72) 24/25 (96)

E N D
Table S3. A comparison of number of cases in CR and ICR after the initiation of corticosteroid therapy between the MCNS patients with a low GD and those with a high GD Duration of the treatment CR 4 weeks 8 weeks CR or ICR 4 weeks 8 weeks High GD number (%) 18/25 (72) 24/25 (96) 19/25 (76) 24/25 (96) FSGS (Reference) number (%) 2/7 (29) 3/7 (43) 3/7 (43) 4/7 (57) Low GD number (%) 13/25 (52) 18/25 (72) 18/25 (72) 22/25 (88) P-value 0.14 0.04 0.75 0.28 Note: The values are presented as the numbers (%) . A high GD as defined as > 3.6/mm2 of GD2. CR as defined as proteinuria of 0.3g/day or less. Abbreviations: CR; complete remission, ICR; incomplete remission, GD; glomerular density