Download
1 / 1
10 likes | 109 Views
This study evaluates scaling relationships between branching structure and biomass partitioning in managed orchard fruit species. The findings suggest conservation in size-mass relationships, potential signals of pruning in shoot growth, and implications for orchard management. Future directions include exploring spatial branching architecture and canopy effects of pruning.

E N D
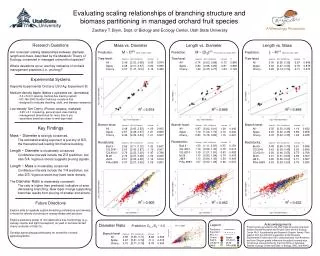
Evaluating scaling relationships of branching structure and biomass partitioning in managed orchard fruit species A Weecology Production Zachary T. Brym, Dept. of Biology and Ecology Center, Utah State University Research Questions Are ‘universal’ scaling relationships between diameter, length and mass, described by the Metabolic Theory of Ecology, conserved in managed orchard fruit species? Where deviations occur, are they indicative of orchard management practices (i.e., pruning)? Experimental Systems Kaysville Experimental Orchard, USU Ag. Experiment St. Medium-density Apple (Malusx sylvestrisvar. domestica) - 3.5 x 5.5 m spacing, Vertical Axe training system - NC-140 2003 Golden Delicious rootstock trial - designed to evaluate dwarfing, yield, and disease resistance Low-density Tart Cherry (Prunuscerasus, mahaleb) - 3.65 x 6.1 m spacing, general open vase training - management abandoned for more than 5 yrs. - secondary branches closer to wild-type habit Key Findings Mass ~ Diameter is strongly conserved. The estimated scaling exponent is just shy of 8/3, the theoretical self-loading limit before buckling. Length ~ Diameter is moderately conserved. Confidence intervals include the 2/3 prediction, but also 3/4. Vigorous shoots suggests pruning signals. Length ~ Mass is moderately conserved. Confidence intervals include the 1/4 prediction, but also 2/3. Vigorous wood may have lowerdensity. TheDiameter Ratio is moderately consistent. The ratio is higher than predicted, indicative of area decreasing branching. Slow taper in large supporting branches results from pruning of smaller end shoots. Future Directions Explore data for spatially explicit branching architecture and develop a model for effects of pruning on canopy shape and structure. Explore predictive power of non-destructive tree morphology (e.g., canopy volume and light interception) on yield in commercial tart cherry orchards of Utah Co. Develop agroecologicalphilosophy for forest-like orchard agroecosystems. Mass vs. Diameter Length vs. Diameter Length vs. Mass Prediction:M ~ D8/3(Niklas& Spatz, 2004) Tree-level: Exponent [95% Confidence] Intercept R2 All - 2.49 [2.32, 2.68] -0.93 0.974 Apple - 2.48 [2.31, 2.67] -0.90 0.980 Cherry - 4.37 [1.47, 12.9] -5.16 0.489 Branch-level: Exponent [95% Confidence] Intercept R2 All - 2.48 [2.43, 2.53] -1.05 0.905 Apple - 2.57 [2.48, 2.67] -1.21 0.869 Cherry - 2.46 [2.39, 2.53] -1.01 0.907 Rootstocks: Exponent [95% Confidence] Intercept R2 Bud.9 -2.56 [2.11, 3.12] -1.25 0.647 CG.3041- 2.63 [2.42, 2.87] -1.19 0.907 CG.6210 -2.76 [2.52, 3.02] -1.47 0.788 M.26 -2.76 [2.47, 3.08] -1.54 0.929 JM.8 -2.51 [2.34, 2.69] -1.13 0.916 PiAu.5683 - 2.47 [2.27, 2.69] -1.06 0.851 Prediction: M ~ (D/2)2/3(Price, Enquist & Savage, 2007) Tree-level: Exponent [95% Confidence] Intercept R2 All - 0.74 [0.63, 0.88] -0.72 0.849 Apple - 0.80 [0.68, 0.95] -0.81 0.892 Cherry - 1.29 [0.35, 4.77] -1.84 0.125 Branch-level: Exponent [95% Confidence] Intercept R2 All - 0.87 [0.82, 0.91] 1.09 0.442 Apple - 1.10 [1.02, 1.19] 0.70 0.420 Cherry - 0.83 [0.78, 0.89] 1.19 0.491 Rootstocks: Exponent [95% Confidence] Intercept R2 Bud.9 -1.50 [1.11, 2.02] 0.33 0.154 CG.3041- 1.14 [0.96, 1.35] 0.75 0.614 CG.6210 -1.39 [1.21, 1.60] 0.43 0.482 M.26 -1.13 [0.83, 1.54] 0.70 0.418 JM.8 -1.13 [0.94, 1.36] 0.54 0.406 PiAu.5683 -1.07 [0.90, 1.28] 0.66 0.347 Prediction: L ~ M1/4(Niklas& Enquist, 2001) Tree-level: Exponent [95% Confidence] Intercept R2 All - 0.30 [0.25, 0.35] -0.67 0.849 Apple - 0.32 [0.27, 0.39] -0.76 0.876 Cherry - 0.29 [0.12, 0.74] -0.71 0.673 Branch-level: Exponent [95% Confidence] Intercept R2 All - 0.35 [0.33, 0.36] 1.19 0.632 Apple - 0.43 [0.40, 0.46] 0.89 0.658 Cherry - 0.33 [0.32, 0.35] 1.28 0.638 Rootstocks: Exponent [95% Confidence] Intercept R2 Bud.9 -0.58 [0.49, 0.70] 0.61 0.688 CG.3041- 0.43 [0.39, 0.48] 0.93 0.840 CG.6210 -0.50 [0.46, 0.55] 0.75 0.766 M.26 -0.41 [0.31, 0.55] 0.99 0.500 JM.8 -0.45 [0.39, 0.53] 0.71 0.587 PiAu.5683 -0.43 [0.38, 0.50] 0.79 0.580 Acknowledgements • Diameter Ratio Prediction: Dk+1/Dk ~ 0.5 • Branch-level Exponent [95% Confidence] Intercept R2 • All- 0.68 [0.65, 0.71] -8.48 0.569 • Apple- 0.67 [0.61, 0.72] -11.4 0.418 • Cherry- 0.75 [0.71, 0.79] -8.78 0.693 Legend Prediction - Exponent - 95% CI - Cherry - Apple - Bud.9 -CG.3041- CG.6210 -M.26 - JM.8 - PiAu.5683 - R2 = 0.569 Project funding provided by the Utah State University Graduate Student Senate Research and Project Grant and the Ecology Center Ph.D. Assistantship and Research Support Award. Field support from the staff and researchers at the Kaysville Experimental Orchard and USU undergraduates Josh Anderson and Josh Shugart greatly influenced the project’s sample size. Conference travel provided by the USU Office of Graduate Studies, Ecology Center and Dept. of Biology, GRC, and ASHS.