Download
1 / 40
400 likes | 566 Views
This study investigates four weaving sections within the Route 7/I-787 interchange. It addresses key elements in analyzing weaving sections, including weave type, length, flow distribution, vehicle speeds, and more. The report also examines the Level of Service (LOS) for each weaving segment, detailing specific characteristics such as lane counts, traffic volumes, and geometric constraints. Observations from various segments provide insights into how traffic density, flow distributions, and peak hour factors influence overall performance and define required conditions for optimal LOS.

E N D
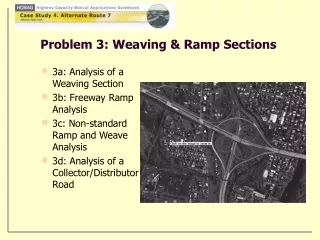
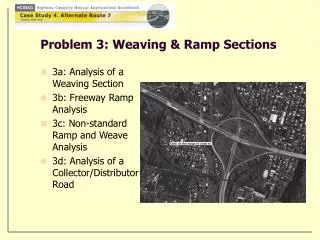
Problem 3: Weaving & Ramp Sections • 3a: Analysis of a Weaving Section • 3b: Freeway Ramp Analysis • 3c: Non-standard Ramp and Weave Analysis • 3d: Analysis of a Collector/Distributor Road
This sub-problem focuses on four weaving sections in the Route 7 / I-787 interchange. Questions to consider: What are some of the elements to consider when studying a weave section? How do we determine the LOS for weave sections? Observations? Sub-Problem 3a
Observations? Route 7 / I-787 Interchange Route 7 A E B I-787 C Weaving sections of interest include:
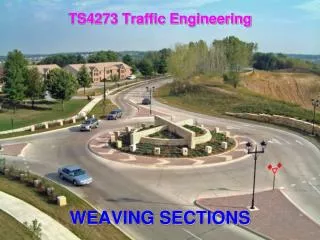
What is important to consider when analyzing a weaving section? 1) Type of weave 2) Weaving length 3) Distribution of flows within the weave 4) Speeds of the weaving & non-weaving movements 5) PHF 6) Percentages of trucks, buses, & recreational vehicles 7) Passenger car equivalents Observations? Weaving Sections
Weaving Segments A & B • Characteristics: • 4 lanes • Length of A = 3100’ • Length of B = 2600’ • Entering & exiting facilities each 2 lanes What type of weave is at each of these locations? View of Route 7 looking west at the western end of Location A Type A How can the speeds for weaving (Sw) & non-weaving (Snw) vehicles be computed? HCM 2000 Eqn 24-2
Weaving Segments A & B At higher volumes what happens to Ww and Wnw? They are also higher Density increases, therefore, LOS decreases What does this mean?
Observations? Weaving Segments A & B There is a signal at the end of weaving section B, where the PM peak traffic is heavy enough that the length of the double-lane queue often extends across the bridge. WHAT DOES THIS MEAN? Weaving vehicles can’t take advantage of the length of the bridge to make their lane changes. Motorists must make a lane change before the end of queueif they want to gonorth on I-787. Then what length of weaving section is required to have a reasonable LOS?
Observations? Weaving Segment C • Characteristics: Inbound facilities: I-787 NB – 3 lanes 23rd St on-ramp – 1 lane Outbound facilities: I-787 NB – 2 lanes Rt 7 EB off-ramp – 2 lanes What type of weave is this? View of I-787 North at Location C just before the two right hand lanes leave to go toward Route 7 east Type C
Do we know the distribution of flows for the weaving and non-weaving segments? How do we get these volumes? Observations? Weaving Segment C No, collecting this type of data in the field requires significant data collection coordination and significant time. Estimate the volumes, then conduct a sensitivity analysis to determine the validity of the estimates
Weaving Segment C • 3 possible scenarios for flow distributions • All the 23rd St on-ramp traffic goes to I-787 N. This maximizes the weaving volumes. • Inbound flows go to the outbound legs proportional to the exiting volumes. • A larger percentage going to D from B (40%). This reduces the amount of traffic from A going to D. Thus, the weaving traffic decreases and the non-weaving traffic increases.
What does it mean that the LOS = C in all cases? Observations? Weaving Segment C The LOS isn’t very sensitive to the distribution of volumes among the four weaving movements Why is the density greatest in scenario 1? What does this mean? Greatest weaving volumes in Scenario 1. The higher the weaving volume the higher the density
Observations? Weaving Segment E • Characteristics: • 3 lanes • Located on I-787 north between Route 7 east on-ramp & Route 7 west off-ramp • Length = 790’ • Heavy PM volumes View of I-787 North at Location E just before the loop ramp diverges to go toward Route 7 west What type of weave is at this location? Type A
Weaving Segment E Assumptions to be made with the input data 1) The FFS on the freeway = 55 mph 2) The speed on the on- and off-ramps = 25 mph 3) The peak hour factor = 1.0.
Observations? Weaving Segment E Based on the results what conclusions can be made? Much better service in the AM
Observations? Weaving Segment E As the PHF increases, the density of traffic in the weaving segment decreases and the speeds increase As the free flow speed increases, the densities decrease and the speeds increase. • How would changing the PHF or Speed affect the results of this weave? Why might the only case of LOS E occur when the PHF = 1 and the FFS = 65 mph?
Observations? Weaving Segment E Change geometric constraints (i.e. length of weave and number of lanes in the weave) What could be done to this facility to improve the LOS? Existing HCM Max
Conclusions from the Weave Analysis • Although there are only several types of weaves, each may have unique characteristics that need to be considered • Changing geometric constraints may improve the operation of a particular weaving section • HCM guidelines need to be checked versus field observations to accurately depict what is going
This sub-problem focuses on some basic issues in ramp analysis. Questions to consider: What analyses might be applied in this problem? What are some of the unique attributes of this analysis that need to be addressed? Observations? Sub-Problem 3b
Observations? Data for Ramps of Interest Capacities from HCM Exhibit 23-3 What factors affect the capacity? What ramps may have problems and at what time of day? - Number of lanes on the ramp - Ramp FFS
Merge sections of interest include: Route 7 J Location I Characteristics: • - single lane on-ramp • - 2-lane freeway • - Acceleration lane ~ 1/10 of a • mile long • - FFS on the ramp = 25 mph Location J Characteristics: • - single lane on-ramp • - 2-lane freeway • - On-ramp continues as 3rd lane • - FFS on the ramp = 35 mph I I-787
Observations? What can be done to improve the LOS to A? Extend acceleration lane
Observations? What would be the effect of changing the acceleration lane length at Location I? What are the benefits of each choice? Existing I w/ J = 3000’ La Max I, Min La@ J Max I, w/ J = 1650’ La
What did we learn from this sub-problem? • We learned what is involved and that the HCM methodologies are distributed among 4 chapters: ramps, weaving sections, unsignalized intersections, and signalized intersections. • We used the v/c ratio analysis technique in the ramps chapter of the HCM and determined that 2 of the ramps in the interchange are at or near capacity. Ideally, their curve radii should be larger or more lanes should be present. • We studied the 2 merges that occur on Route 7 going WB. We noticed that one ramp is difficult to analyze because the acceleration lane never ends, it continues on as a 3rd lane on the freeway. We determined how to analyze the level of service of this. We lengthened the acceleration lane on the 1st ramp to determine how to achieve LOS A. We found that the pair of ramps could be made to work well, and the length of the ramp had an impact on performance.
This sub-problem focuses on the southwestern quadrant of the I-787 interchange, where the ramps are all non-standard. What is non-standard? The diverge from Route 7 EB The split into a collector/distributor road The right-hand ramp from Route 7 EB to I-787 SB The semi-direct ramp from Route 7 WB to I-787 SB The merger of these two ramps with each other and with I-787 SB Observations? Sub-Problem 3c
Route 7 EB Diverge • No deceleration lane. (The exit ramp leaves Route 7 as soon as it appears. So we need to set the length of the deceleration lane at zero.) • Exit ramp leads to the collector/distributor road (we need to include the traffic taking the loop ramp to I-787 north as well as the traffic taking the right-hand ramp to I-787 south.)
The Short Connector • 150-foot long single-lane ramp between Route 7 east and the beginning of the lane for the collector/distributor road. • An analysis of this roadway segment will tell us if this might be the bottleneck. We’ll compare the volume it handles with the capacity it ought to have per the HCM. • The exiting volume is 2,020 veh/hr, while the suggested capacity for a single-lane ramp is 2,000 veh/hr; so the v/c ratio is 1.01.
The Right-Hand Ramp • AM Peak volume on the right-hand ramp = 1,865 veh/hr • The HCM says capacity for a single lane ramp with a free flow speed of 30 mph should be 1,900 veh/hr; so the v/c ratio is 0.98
4-lane basic freeway section at the merge point • FFS= 65 mph • Volume = 5,290 veh/hr • Density = 20.8pc/mi/ln, which is LOS C. • The HCM ramp procedure asks us to specify lengths for both the 1st and 2nd acceleration lane. • The 1st ramp ends 790 feet downstream of the initial merge, but the 2nd lane doesn’t end (so assume a long arbitrary distance)
Merge Analysis • Set 1st lane length to 790’ • Set 2nd lane length to 4,000’ What is the new influence area Density? D = 3.9 pcpmpl What was the density of where the 4 lane merge starts? D = 20.8 pcpmpl The introduction of a long acceleration lane significantly reduces the density Why is there such a difference in the densities?
With D = 3.9 pcpmpl what is the LOS of this merge? A F or ? Why such a poor LOS with a low density? The combined volume from the ramps and the freeway (5,400 veh/hr) produce an influx into the influence area, which is more than the 4,600 veh/hr allowed
Observations? I-787 SB Weave Analysis What type of weave is this? Type B Note: The starting point of the weave is ambiguous. The striping at the north end of the weave tries to keep the weave from starting until the lane drop occurs. Weaving Diagram for Weave D AM Peak Hour Volumes Would the weave start early or later under heavier traffic conditions? Earlier
Conditions Depending on Length of Weave What are the effects of having a weave that varies in length? What would have to happen to improve the LOS? Although LOS remains poor, as length increases, density decreases!! Much greater weave length
What did we learn from this sub-problem? • This sub-problem shows that we can use engineering judgment in combination with the HCM capacities for single and multi-lane ramp sections to determine where problem spots might exist in the interchange. • We also see the attention to detail that is required to identify bottlenecks. • In summary, there is more than one way to view a given situation. Different views are possible, producing different results. Our responsibility as traffic engineers is to identify these views, study the system from each, and portray the results clearly and concisely to decide what recommendations to make regarding facility enhancements.
This sub-problem deals with the short, single-lane collector/distributor road that connects to two ramps: the I-787 SB to Route 7 EB loop ramp at its end and the Route 7 EB to I-787 NB loop ramp at its beginning. The focus of this sub-problem is not on the high volumes or congested conditions but on the complexities of performing the analysis. The collector-distributor doesn’t fit any standard facility type, yet it needs to be analyzed. Observations? Sub-Problem 3d Consider how you might analyze this collector/distributor roadway using the methodologies presented in the HCM 2000
Layout of the Collector-Distributor • The collector-distributor (C-D) connects to Route 7 EB as a single lane exit without a deceleration lane. • It continues as a single lane for approximately 250’ and a new lane is added on the left-hand side. The new left-hand lane becomes the continuation of the C-D road, which means the C-D traffic has to jog left one lane, while the original lane continues ahead to become the start of the right-hand ramp leading to I-787 SB. • These two lanes parallel each other for about 1,000’ until the right-hand lane turns toward I-787 SB. The left-hand lane, the C-D road, continues on for 1,800’ until it joins with the I-787 SB/Route 7 EB loop ramp. • The 1 lane C-D road and the 1 lane loop ramp now become a 2-lane facility. • These 2 lanes continue across a bridge for about 260’ until the right-hand lane becomes the beginning of the loop ramp to I-787 NB. • We have a small weaving section that starts with the end of the loop ramp from I-787 SB and ends with the beginning of the loop ramp to I-787 NB. • After the loop ramp to I-787 NB turns off to the right, the C-D road continues on another 300’ where it rejoins Route 7 EB.
Collector-Distributor Weaving Section Characteristics of the Weave: • 2 lanes on the C-D Road • Length of Weave = 264’ • FFS = 40 MPH • Type A Weave • B-D volume = 0 Here we will focus on the weaving section that takes place with the C-D Road When doing the weaving analysis for the C-D Road what makes it difficult? There is only 1 lane on the freeway How can that be worked around? Assume 2 lanes on the C-D Road
Results of the C-D Weave D = 5.02 pc/mi/ln LOS = A Unconstrained operation Weaving & non-weaving speeds are about 33-35 mph The number of lanes required (Nw = 1.18) is less than the number needed for unconstrained operation (1.4). What does this mean? Although we assumed the C-D road was 2 lanes wide, and the weaving section 3 lanes wide, only 1.18 lanes were required for the weaving movements to be unconstrained. The remaining 0.82 lanes were available for any non-weaving traffic using the C-D road as an alternative to the mainline lanes for Route 7 EB.
What did we learn from this sub-problem? • We encountered another situation where the highway geometrics are non-standard from the perspective of the HCM; so we need to determine how the situation should be analyzed. • Second, a weaving analysis is possible and appropriate between the loop ramps, provided more-than-normal care is taken in examining and interpreting the results of the analysis. • Third, the computed number of lanes required for an unconstrained weave needs to be compared with the number of lanes available, realizing that the non-weaving movements are effectively zero. This means that if the weaving movements are acceptable, the entire weaving section is also acceptable.