Download
1 / 22
220 likes | 319 Views
Explore antihypertensive treatments in Renin-Angiotensin System pathways, ACE inhibitors, and Angiotensin II receptor antagonists. Learn about PKC inhibitors and correlations with diabetic retinopathy severity.

E N D
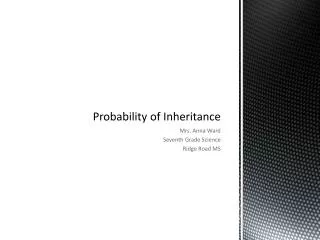
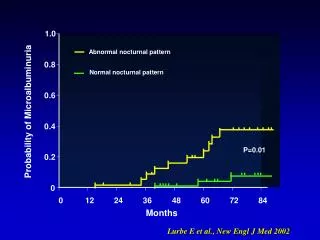
1.0 Abnormal nocturnal pattern 0.8 Normal nocturnal pattern 0.6 Probability of Microalbuminuria 0.4 P=0.01 0.2 0 0 12 24 36 48 60 72 84 Months Lurbe E et al., New Engl J Med 2002
Antihypertensive treatment approaches in the Renin Angiotensin System ACE pathways Non-ACE pathways Angiotensinogen Chininogen Cathepsin G Renin Bradichinin Angiotensin I Chymase ACE ACE-inhibitor Angiotensin II AT receptor antagonist Inactive fragments AT receptor Sodium and fluid retention Vasoconstriction Cell growth Simpathetic activation
ACE inhibitors • Captopril 1.0-6.0 mg/kg/d 8 hours • Enalapril 0.2-0.5 12-(24) • Lisinopril 0.2-1.0 24 • Ramipril 0.05-0.015 24 Angiotensin II receptor antagonists • Candesartan 0.1-0.3 mg/kg/d 24 hours • Irbesartan 2.0-6.0 24 • Losartan 0.5-1.5 24
When ACE-I or AII-I should be used in adolescents with diabetes? • Hypertensive patients with or without persistent microalbuminuria • Patients with persistent microalbuminuria with or without hypertension • Normotensive and normoalbuminuric patients, with family history of diabetic nephropathy, hypertension or CVD
Persistent microalbuminuria (AER 20-50 mg/min/1.73 m2) Hypertension Normal BP Improve HbA1c and reduce DPI for 6-12 months Treat with ACE-I or AII antagonists Stop smoking! No improvement of AER Decreased AER Wait and see Chiarelli F et al., Pediatric Diabetes, 2002
4. Others? PKC inhibitors
PKC : A Pathway to Vascular Complications Hyperglycaemia Advanced glycosylation endproducts (AGE) Diacylglycerol (DAG) Oxidative Stress PKC ß + d activation LY333531 Vasculature Heart Retina Nerve Kidney Vision Loss Amputation Dialysis/transplant CVD/CAD PVD Source: Diabetes and Ocular Disease, Future Therapies for Diabetic Retinopathy; Page 260
CORRELATION OF PKC ACTIVITIES IN THE MONOCYTES WITH SEVERITY OF DIABETIC RETINOPATHY HCT=Control, DM=Pt. with diabetes, NDR=No diabetes NPDR=No proliferative retinopathy, PDR=Proliferative Retinopathy
7 p=0.007 6 p=0.006 5 4 3 (µL plasma/gm retina dry wt/hr) Evans-blue albumin permeation 2 1 0 NDM- NDM+ DM- DM+ Animal Groups Retinal permeability measured in non-diabetic and diabetic SD rats after secondary intervention with PKC ß inhibitor, LY333531 (2 weeks control, 2 weeks LY)
LY333531(PKC b Inhibitor) and Retinal Circulation Time Diabetic Patients 1.2 1 0.8 MORE NORMAL Extent of MCT Abnormality 0.6 0.4 0.2 Nondiabetic Nondiabetic 0 Placebo 16 mg/d 32 mg/d P<.03. MCT, mean circulation time. Nondiabetic(historical controls)=0
albuminuria 350 300 250 200 150 100 50 0 A C g/24 hrs B D mesangial fractional area 25 20 15 10 5 0 % A untreated db/m mice B LY333531-treated db/m mice C untreated db/db mice D LY333531-treated db/db mice LY333531 prevents experimental diabetic nephropathy Koya D et al, FASEB J, 2000
Initial Results of the Protein Kinase C Inhibitor Diabetic Macular Edema Study (PKC-DMES) Lloyd P. Aiello1, Matthew D. Davis2, Roy C. Milton3, Matthew J. Sheetz4, Vipin Arora4, Louis Vignati4, and the PKC-DMES Study Group 1Joslin Diabetes Center, Harvard Medical School, Boston, MA; 2Fundus Photograph Reading Center, University of Wisconsin, Madison, WI;3EMMES Corporation, Rockville, MD;4Lilly Research Laboratories, Indianapolis, USA
Progression of DME in Patients with Baseline HbA1c 10% (75% of all patients) Log Rank p-value = 0.02 Cox model p-value = 0.02
Crk- Cap Cbl Tc10 Glucose P P SOS Ras Gbr2 p110 p85- PI 3-Kinase IRS-3 IRS-4 IRS-1 IRS-2 P P P P P P P P P P Raf MEK MAP Kinase p90 rsk Akt / aPKC Gab-1 Glucose Transport p70 S6K GSK3 Glycogen / Lipid Protein Synthesis Cell Growth Differentiation Some Gene Expression Insulin Signaling Pathways Insulin/IGF-1 Receptors P P P P P Shc
PKC activation Is Causing Selective Insulin Resistance In Cardiovascular Tissues INS & Ins Receptor IRS1/2 • Shc Grb-2 Ras • MAP K Matrix, Migration, GROWTH OF SMOOTH MUSCLE CELLS PRO-ATHEROGENESIS (-) PI3 K PDK1 PDB/Akt (+) PKC , DAG, MAPK Glucose, FFA Diabetes & Insulin Resistance (-) AGE, Oxidants, Lipids e NOS +VEGF, VASODILATION ANTI-APOPTOSIS ANTI-ATHEROGENESIS
2500 cont ins 2000 * 1500 1000 500 0 PKC- Inhibition on Insulin-stimulated Akt Activation and NO-mediated cGMP levels in the microvessels of Zucker Lean (L) and Fatty (F) Rats Akt activation B. cGMP Levels A. 400 cGMP (fmol/mg protein) % of control 200 * L L F F L L F F LY333531 - + - + - + - + LY333531=PKC b isoform inhibitor
Andrea Mezzetti Francesco Cipollone Franco Cuccurullo Guido Morgese Acknowledgments • Angelika Mohn • Stefano Tumini • Alberto Verrotti • Annalisa Blasetti • Francesca Santilli • Anna Spagnoli • Annalisa Iezzi • Maria Fazia • Mirko Zucchelli • Barbara Pini • Cosimo Giannini
Michelangelo Buonarroti The adolescent Hermitage - San Petersburg