Download
1 / 29
290 likes | 368 Views
This study presents additional figures detailing motif enrichment and depletion in intronic neighborhoods related to upregulated and downregulated cassette exons. It provides insight into the high-resolution motif enrichment for specific sequences in different tissues and cell lines. Furthermore, it examines the association of motifs with RNA-binding proteins across 48 tissues using rank-order statistics. The figures shed light on the intricate regulatory mechanisms underlying alternative splicing events in human biology.

E N D
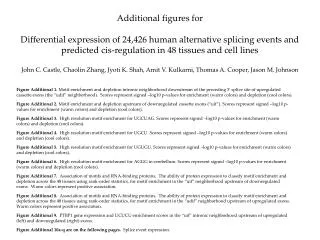
Additional figures for Differential expression of 24,426 human alternative splicing events and predicted cis-regulation in 48 tissues and cell linesJohn C. Castle, Chaolin Zhang, Jyoti K. Shah, Amit V. Kulkarni, Thomas A. Cooper, Jason M. Johnson Figure Additional 1. Motif enrichment and depletion intronic neighborhood downstream of the preceding 5' splice site of upregulated cassette exons (the “udif” neighborhood). Scores represent signed –log10 p-values for enrichment (warm colors) and depletion (cool colors). Figure Additional 2. Motif enrichment and depletion upstream of downregulated cassette exons (“uif”). Scores represent signed –log10 p-values for enrichment (warm colors) and depletion (cool colors). Figure Additional 3. High resolution motif enrichment for UGCUAG. Scores represent signed –log10 p-values for enrichment (warm colors) and depletion (cool colors). Figure Additional 4. High resolution motif enrichment for UGCU. Scores represent signed –log10 p-values for enrichment (warm colors) and depletion (cool colors). Figure Additional 5. High resolution motif enrichment for UGUGU. Scores represent signed –log10 p-values for enrichment (warm colors) and depletion (cool colors). Figure Additional 6. High resolution motif enrichment for AGGG in cerebellum. Scores represent signed –log10 p-values for enrichment (warm colors) and depletion (cool colors). Figure Additional 7. Association of motifs and RNA-binding proteins. The ability of protein expression to classify motif enrichment and depletion across the 48 tissues using rank-order statistics, for motif enrichment in the “uif” neighborhood upstream of downregulated exons. Warm colors represent positive association. Figure Additional 8. Association of motifs and RNA-binding proteins. The ability of protein expression to classify motif enrichment and depletion across the 48 tissues using rank-order statistics, for motif enrichment in the “udif” neighborhood upstream of upregulated exons. Warm colors represent positive association. Figure Additional 9. PTBP1 gene expression and UCUCU enrichment scores in the “uif” intronic neighborhood upstream of upregulated (left) and downregulated (right) exons. Figure Additional 10a-q are on the following pages. Splice event expression.
Figure Additional 1 Motif enrichment and depletion intronic neighborhood downstream of the preceding 5' splice site of upregulated cassette exons (the “udif” neighborhood). Scores represent signed –log10 p-values for enrichment (warm colors) and depletion (cool colors).
Figure Additional 2 Motif enrichment and depletion upstream of downregulated cassette exons (“uif”). Scores represent signed –log10 p-values for enrichment (warm colors) and depletion (cool colors).
Figure Additional 3 High resolution motif enrichment for UGCUAG. Scores represent signed –log10 p-values for enrichment (warm colors) and depletion (cool colors).
Figure Additional 4 High resolution motif enrichment for UGCU. Scores represent signed –log10 p-values for enrichment (warm colors) and depletion (cool colors).
Figure Additional 5 High resolution motif enrichment for UGUGU. Scores represent signed –log10 p-values for enrichment (warm colors) and depletion (cool colors).
Figure Additional 6 High resolution motif enrichment for AGGG in cerebellum. Scores represent signed –log10 p-values for enrichment (warm colors) and depletion (cool colors).
Figure Additional 7 Association of motifs and RNA-binding proteins. The ability of protein expression to classify motif enrichment and depletion across the 48 tissues using rank-order statistics, for motif enrichment in the “uif” neighborhood upstream of downregulated exons. Warm colors represent positive association.
Figure Additional 8 Association of motifs and RNA-binding proteins. The ability of protein expression to classify motif enrichment and depletion across the 48 tissues using rank-order statistics, for motif enrichment in the “udif” neighborhood upstream of upregulated exons. Warm colors represent positive association.
Figure Additional 9 PTBP1 gene expression and UCUCU enrichment scores in the “uif” intronic neighborhood upstream of upregulated (left) and downregulated (right) exons.
Figure Additional 10a-q are on the following pages. Splice event expression. Similar figures as PNG format are found on the website http://rulai.cshl.edu/Rosetta_AS_supp/index.html as file Images_png.zip [717Mb].