Download
1 / 34
340 likes | 470 Views
ECONOMICS OF THE PHARMACEUTICAL INDUSTRY 25 th March 2004. Jon Sussex Office of Health Economics www.ohe.org. Agenda. The supply side – R&D Demand for medicines NICE – the cost-effectiveness ‘4 th hurdle’ Regulating medicine prices. Characteristics of Medicines Markets.

E N D
ECONOMICS OF THE PHARMACEUTICAL INDUSTRY25th March 2004 Jon Sussex Office of Health Economics www.ohe.org
Agenda • The supply side – R&D • Demand for medicines • NICE – the cost-effectiveness ‘4th hurdle’ • Regulating medicine prices
Characteristics of Medicines Markets • Supply is R&D intensive, which implies: • Intellectual property rights (patents) • Long lead times • High risk • Dynamic competition as important as static • Generic competition after patent expiry • Demand is regulated – governments and social insurers are major buyers of medicines • Prices are regulated
Supply Side – Main Characteristics (1) • Patents are an incentive for dynamic efficiency – by promising temporary monopoly if successful • Patents last 20 years; first 9-11 of which are spent getting the medicine to market, i.e. research & development (R&D) • Commercial success in R&D-based companies depends on finding ‘blockbusters’
Supply Side – Main Characteristics (2) • Average R&D cost of a new medicine up to launch is $800 million • Includes costs of failures • Out of pocket costs ≈ 50% • Opportunity cost of capital ≈ 50% • Only ≈ 30% of launched medicines earn revenues that exceed their lifetime costs
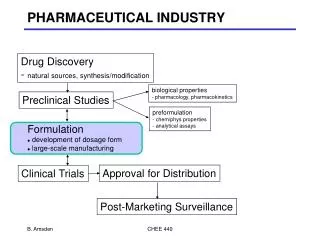
Marketing approval product launch Investigational new drug application Regulations 1990 1993 1999 2001 Time (years) Discovery research Regulatory review Phase I Phase II Synthesis Biological testing & pharmacological screening Basic research Phases of drug development 50-100 voluns 200-400 patients Long-term animal testing Clinical phases Chemical development Pharmaceutical development 2-3 1 1 5,000 8-15 4-8 Discovery and Development of a New Medicine Phase III Final patent application Marketing application Development research Post-mktng devel Phase IV 3000 + patients Toxicology and pharmacokinetic studies Attrition rates Cost $800M 0 Source: CMR International
Cash Flow for a Successful Medicine £ p.a. + Launch 0 Time Patent expiry _
Supply Side – Main Characteristics (3) • R&D costs are sunk (global) joint costs • R&D costs ≈ 17% of pharmaceutical sales p.a. But ≈ 31% of costs on net present value basis • => (even long-run) marginal cost << average cost • => Price discrimination (based on Ramsey rule?) if non-linear pricing is impractical • Parallel trade
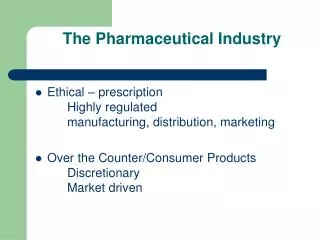
Types of Medicines * OTCs = over the counter (i.e. non-prescription) medicines
Measures Affecting Prescriber Price Sensitivity • Primary Care Trust budgets • Practice budgets and prescribing incentive schemes • Provision of information (PACT, NICE guidance, pharmaceutical advisers, etc.) • Generic prescribing targets
National Institute for Clinical Excellence • Covers England & Wales • Two main outputs: • Technology appraisals • Clinical guidelines
Technology Appraisal Criteria • The Institute and Appraisal Committee will have regard to: • the broad clinical priorities of the Secretary of State for Health and the Welsh Assembly Government • the degree of clinical need of patients with the condition • the broad balance of benefits and costs • any guidance from the Secretary of State for Health and the Welsh Assembly Government on the resources likely to be available and on such other matters as they think fit • the effective use of available resources
NICE’s Guide to Methods of Technology Appraisal • Below a most plausible incremental cost-effectiveness ratio (ICER) of £20,000/QALY, judgments about the acceptability of a technology as an effective use of NHS resources are based primarily on the cost-effectiveness estimate. • Above a most plausible ICER of £20,000/QALY, judgments about the acceptability of the technology as an effective use of NHS resources are more likely to make more explicit reference to factors including: • the degree of uncertainty surrounding the calculation of ICERs • the innovative nature of the technology • the particular features of the condition and population receiving the technology • where appropriate, the wider societal costs and benefits • Above an ICER of £30,000/QALY, the case for supporting the technology on these factors has to be increasingly strong
Completed Appraisals (- Jan 2004) • 75 (including re-appraisals), of which 52 have been of pharmaceuticals: • restrictions in 32 appraisals e.g. Alzheimer’s drugs recommended in patients with mini mental state examination>12 e.g. zanamivir, oseltamivir recommended in at-risk patients with influenza • a technology has been rejected in 13 appraisals e.g. MS drugs anakinra for rheumatoid arthritis (except in a controlled long term clinical study) • NICE has also issued 21 clinical guidelines (11 inherited)
Economic Evaluation Elsewhere • Focused on pharmaceuticals • Fourth hurdle i.e. reimbursement decisions: • Public reimbursement: Australia, Baltic countries, Belgium, Canada (British Columbia, Ontario), Czech Republic, Denmark, Finland, France, Hungary, Netherlands, New Zealand, Norway, Portugal, Russia, Slovenia, Sweden • US managed care formularies • Pricing negotiations • Australia, France, Italy, New Zealand • Advice to health service • England and Wales (NICE), Scotland • Risk sharing arrangements • Australia, New Zealand, UK (only MS drugs to date)
Why Regulate? - Market Failure • Public goods and the free-rider problem (e.g. research) • Externalities • E.g. your vaccination reduces my risk of catching an infection • E.g. the caring externality: I’m happy if you’re cared for • Incomplete or asymmetric information • Moral hazard (= ‘hidden action’) • Selection problem (= ‘hidden information’) • Principal/agent problems
Monopoly Power • Economies of scale and/or scope – but NB contestability • Natural (local) monopoly • Input constraints • Patents: dynamic efficiency vs static monopoly
Net Value of the Pharmaceutical Industry– Economic Rent Estimates for 2000: £ million p.a. Producer rents (exports & overseas) 500-1,500 Labour rents 80-160 R&D spillovers to other sectors 120-360 Total rent 700-2,000 Terms of trade effect ? Source: Pharmaceutical Industry Competitiveness Task Force (2001) ‘Value of the Pharmaceutical Industry to the UK Economy’
Options: Types of Regulation • ‘No regulation’ = Competition Act only • Profit, i.e. rate of return, control: • Unbanded • Banded • Price control: • Baskets of products, as with ‘RPI-X’ control of utilities’ prices • Individual products, e.g. via reference prices, or ‘cost-plus’, or related to therapeutic benefit
1998 Competition Act • Came into force March 2000 • Based on EU Treaty - Articles 81 & 82 • Prohibitions: • Chapter 1 – Agreements preventing, restricting or distorting competition • Chapter 2 – Abuse of a dominant market position • Fines up to 10% of turnover; 3rd parties may sue for damages
Banded Rate of Return Regulation %RoR ▲ ▲ Outturn RoR > threshold => repay excess ▲ ▲ Target RoR ▲ Outturn RoR < threshold => may increase prices ▲ 0 £ capital employed
RPI-X Regulation of a Basket of ‘n’ Products w1p11 + w2p12 + w3p13 + …….. + wnp1n --------------------------------------------------- -1 x 100 ≤ ΔRPI - X w1p01 + w2p02 + w3p03 + …….. + wnp0n Where: wi = weight for product ‘i’ (e.g. quantity sold in period 0) pti = price of product ‘i’ in period t = 0,1 ΔRPI = % change in retail price index between period 0 and period 1 X = efficiency factor { {
Regulation Criteria • Static efficiency: • Productive efficiency • Allocative efficiency • Dynamic efficiency • Benefit to UK plc – economic rent • Regulatory (administrative) burden • Equity/other social policy objectives
Exercise • What, if anything, to regulate? • On- and/or off-patent? • Branded and/or unbranded? • Prescribed and/or over-the-counter? • Sales to NHS only, or all UK sales? • If so, how? • Rate of return control, unbanded • Rate of return control, banded • Price control – basket, RPI-X • Price control – individual products, reference prices • From 3 perspectives: • General public: patients & taxpayers • Government • Industry
Key Questions • How price-sensitive are the people making the consumption choices? • How much competition is there between one medicine and another, or between medicines and alternative treatments? • Do producers have incentives to keep costs down? • Will production and consumption choices become increasingly distorted over time? • Do producers have incentives to invest in the UK, especially in R&D? • Would the regulatory system be costly for the regulator to administer and the companies to comply with?
Pharmaceutical Price Regulation Scheme 1999 • Have been variants of PPRS since 1960s • Department of Health acts as regulator for whole UK • Objectives of 1999 PPRS: • Secure the provision of safe and effective medicines for the NHS at reasonable prices • Promote a strong and profitable R&D-based pharmaceutical industry • Encourage efficient and competitive development and supply of medicines • Voluntary – but (unspecified) statutory alternative scheme for firms that opt out
PPRS 1999 (continued) • Covers all branded medicine sales – on-patent & branded generics – to NHS by companies selling > £1m p.a. to NHS (≈80% of total sales to NHS) • Return on capital ≥ 29.4% => repay excess to DoH • Return on capital ≤ 8.5% => may apply for price increase(s) to take RoC to 13.6% • R&D costs allowed up to 20% of sales • Promotion costs allowed up to 7% of sales • Free pricing at launch but no increases then allowed unless company’ RoC falls to ≤ 8.5%
Multilateral, Ex-manufacturer, Price Comparisonsat Market Exchange Rates Source: Department of Health (2003) PPRS 7th Report to Parliament
Understanding the methodological issues • Manufacturers’ prices or final selling price to the payer? • Brands or generics or molecules? • Sample size and selection (value versus volume, degree of market coverage) • Bilateral versus multilateral • Match single pack, match product form or price per unit (tablet, DDD, IMS SUs, Kg)? • Volume weights: unweighted, own country (Paasche) or foreign weights (Laspeyres)? • Choice of exchange rate • What exactly is the question you are trying to answer?
Pharmaceutical Price Regulation Scheme 1999 • Have been variants of PPRS since 1960s • Department of Health acts as regulator for whole UK • Objectives of 1999 PPRS: • Secure the provision of safe and effective medicines for the NHS at reasonable prices • Promote a strong and profitable R&D-based pharmaceutical industry • Encourage efficient and competitive development and supply of medicines • Voluntary – but (unspecified) statutory alternative scheme for firms that opt out
PPRS 1999 (continued) • Covers all branded medicine sales – on-patent & branded generics – to NHS by companies selling > £1m p.a. to NHS (≈80% of total sales to NHS) • Return on capital ≥ 29.4% => repay excess to DoH • Return on capital ≤ 8.5% => may apply for price increase(s) to take RoC to 13.6% • R&D costs allowed up to 20% of sales • Promotion costs allowed up to 7% of sales • Free pricing at launch but no increases then allowed unless company’ RoC falls to ≤ 8.5%