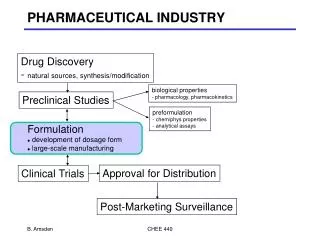
Pharmaceutical Industry
Pharmaceutical Industry. The Global pharmaceutical industry-part-2. The Framework of five forces. Potential entrants. Suppliers. Buyers. Substitutes. Implication of the five forces Potentials entrants “Treat of entry”.

Pharmaceutical Industry
E N D
Presentation Transcript
The Global pharmaceutical industry-part-2 • The Framework of five forces. Potential entrants Suppliers Buyers Substitutes
Implication of the five forcesPotentials entrants “Treat of entry” Barriers to entry are the factors that need to be overcome by new entrants if they are to compete in industry. Typical barriers are as follows .
Scale and experience • In some industries, economies of scale are extremely important. Once incumbents “existing competitors” have reached large-scale production, it will be very expensive for new entrants to match them and until they reach a similar volume they will have higher unit costs. This scale effect is increased where there are high investment requirements. For example in pharmaceuticals for a new entrants it will be high-cost investment to reach a similar volume of large-scale production of their competitors.
Experience curve • The experience curve effects that give incumbents “the existing competitors” a cost advantage because they have learned how to do things more efficiently than an inexperienced new entrant could possibly do. Until the new entrant has built up equivalent experience over time it will tend to produce at higher costs. In this case the new entrant of pharmaceutical industries have to produce the drugs in a higher cost.
Access to supply or distribution channels • In many industries manufacturers have had control over supply and/or distribution channels. Sometimes this has been through direct ownership “vertical integration” sometimes just through customer or supplier loyalty. In this industry, the countries with supply side controls negotiating price or reimbursement approval can take as long as a year. In those with demand-side controls there are delay in market penetration while negotiating endorsement by bodies such as the National Institute for clinical Excellence (NICE) in the UK, The impact of NICE decision on cost-effectiveness reverberates well beyond the UK , as countries have began to collaborate internationally in their value assessment
Expected Retaliation • In an organisation considering entering an industry believes that the retaliation of an existing firm will be so great as to prevent entry, or mean that entry would be too costly, this is also a barrier. Retaliation could take the form of a price war or a marketing blitz. Just the knowledge that incumbents are prepared to retaliate is often sufficiently discouraging to act as a barrier. For examples, in pharmaceutical industry the existing companies maybe cant start price war to because of the tight regulation but the existing companies can use their power for more R&D
The power of suppliers • Supplier are those who supply the organisation with what it needs to produce the product or service. As well as fuel raw materials, and equipment, this can include labour and sources of finance. The factor increasing supplier power are the converse to those for buyer power.
Control on suppliers, Mixed effect, controls to influence demand • Control on suppliers Mixed effect controls to influence demand Partial reimbursement at price Patient co payment negotiated with manufacturer Treatment guidelines • Negotiated prices Indicative or fixed budgets • Average Pricing Generic substitution • Reference Prising Incentives to prescribe or • Positive and negative lists dispense generics or or parallel imports • Constraints on wholesalers And pharmacists. • Imposed price cuts Transfer from prescription-only to OTC
Those supplier power is likely to be high where there are : • Concentrated suppliers, where just a few producers dominate supply, suppliers have more power over buyers. • High switching cost. If its expensive or disruptive to move from one supplier to another, the buyer becomes relatively dependent and correspondingly weak. • Supplier competition threat. Suppliers have increased power where they are able to cut out buyers acting as a middleman
Vertical integration • Most organisations have many suppliers, so it is necessary to concentrate the analysis on the most important ones or types. If their power is high ,suppliers can capture all their buyers ` own potential profit simply by raising their price.
Bargaining power of Buyer In the Pharmaceutical industry the buyers power mainly associated with the large quantity buyers example Government institutions The institutions has considerable bargaining power with drug companies and exerts strong downward pressure on drug prices The Consumer has no choice but to buy what has been prescribed to them therefore their power is low in the pharmaceutical industry. The buyers are scattered and they as such does not wield much power in the pharmaceutical pricing.
Threat of substitutes In early years threat of substitute was low • Pharmaceutical companies compete fiercely to establish and retain Intellectual rights only by securing a patent that can be defended against imitators can the value of all R&D be recouped. • Patent laws prohibited companies from replicating other companies brand name drugs . • Consumer brand loyalty provides defence against generic competition and prolong the product life cycle In recent years threat of substitute was high • Patent: Enforcing Global Intellectual Protection Rights is expensive • Switching to generics is one way to save costs after a drug expires companies can make generics for less costs and no R&D is required.
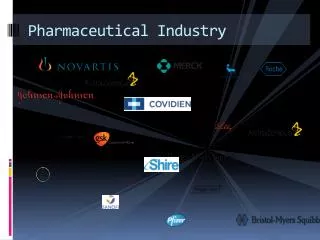
Competitive Rivalry „Competitive rivals are organisations with similar products and services aimed at the same customer group = direct competitors“
Competitive Rivalry • Highly risky and lengthy research and development (R&D) process once you do R&D and invested in technology platforms you won´t exit • Stringent government regulation only few companies; costs regulated by the government • Generics had major impact on the industry, driving innovation and a race to market • There is effectively only one powerful purchaser, the government ‚monopsony‘ • Cost structure: 25% manufacturing of goods; 16-24% R&D; 10% administration; 25% sales and marketing high fixed costs ($1bn develop new drug) • Top 10 generics companies account nearly half of the global market (1990,USA) • Biotechs: very long product development cycle, most biotechs take years to reach profitability. 2008 revenues of $95bn were concentrated in a tiny subgroup of highly profitable firms
Competitive Rivalry • OTC medicines: market was estimated at $104bn in 2008 with the top 10 manufacturers accounting more than half of value • Vaccines: $20bn market with 5 global players account for over 85% market share • Vaccine sales grew 32% p.a. 2004-207 due to HPV-vaccine high growth rate but vaccines have higher development success rates • Majority of global pharmaceutical sales originate in 10 key countries contributing over 80% of the global market • Pharmaceutical market growth is strongly aligned with GDP growth. USA 2008: $291bn which makes 40% of global sales markets are undifferentiated • USA contribution to global growth fell from over 50% to 9% in just two years (2006-2008) fewer new products; higher competition • Japan 2nd largest market for pharmaceuticals ($77bn in 2008); had to face turbulences in the 1990s limited market growth to an average below 3% from 1994-2008
Competitive Rivalry • Annual growth rate of the European market was expected to be constrained to 3-6% per year from 2008 to 2013 slow market growth • Brazil, Russia, India, China, Mexico, South Korea and Turkey were predicted to contribute almost half of market growth from 2009 to 2013 markets are undifferentiated • Blockbusters exacerbated the impact of patent expiries. The Top 15 companies were projected to lose $70bn in sales from 2009 to 2019 due to generic erosion slow market growth • mergers & acquisitions helped companies to stay in competitive rivalry e.g. Sanofi Aventis • High competitive rivalry
References • Exploring Strategy • Text and cases • Gerry JOHNSON & Richard WHITTINGTON