Download
1 / 21
240 likes | 446 Views
VON KARMAN INSTITUTE FOR FLUID DYNAMICS. SENSITIVITY ANALYSIS ON TURBULENCE MODELS FOR THE ABL IN COMPLEX TERRAIN. Daniel Cabezón CENER, National Renewable Energy Centre (Spain) Wind Energy Department dcabezon@cener.com. Javier Sanz, Jeroen Van Beeck

E N D
VON KARMAN INSTITUTE FOR FLUID DYNAMICS SENSITIVITY ANALYSIS ON TURBULENCE MODELS FOR THE ABL IN COMPLEX TERRAIN Daniel Cabezón CENER, National Renewable Energy Centre (Spain) Wind Energy Department dcabezon@cener.com Javier Sanz, Jeroen Van Beeck Von Karman Institute for Fluid Dynamics (Belgium) Environmental and Applied Fluid Dynamics sanz@vki.ac.be, vanbeeck@vki.ac.be
VON KARMAN INSTITUTE FOR FLUID DYNAMICS INDEX • Introduction • Turbulence modelling of the ABL 2.1 Standard k-ε model (Default / modified) 2.2 RNG k-ε model 2.3 Realizable k-ε model • Alaiz test site 3.1 General description 3.2 Data for validation • Simulation features 4.1 Computational domain. Set up 4.2 Wall functions • Results 5.1 Mean flow 5.2 Turbulent characteristics • Conclusions
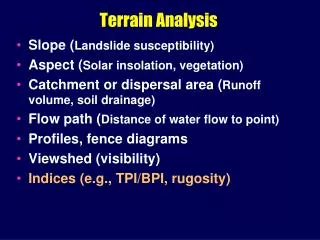
VON KARMAN INSTITUTE FOR FLUID DYNAMICS 1. INTRODUCTION • Target: IEC classification of wind turbine locations on wind speed and turbulence intensity on complex terrain • Linear software: uncertainty increase in power production and fatigue loading at those sites • Development, adaptation and assessment of CFD codes for solving the Atmospheric Boundary Layer (ABL) • Key issue: Selection of the appropiate turbulence closure scheme • We need: • Solve ABL for rugged complex terrain sites • Microscale resolution (10m-20m) • Reasonable computing time • Robust and efficient model ISOTROPIC K-ε MODEL
VON KARMAN INSTITUTE FOR FLUID DYNAMICS 1. INTRODUCTION • Important attempt to adapt k-ε model to moderate terrain sites • ASKERVEIN hill test case: extensively instrumented site • It allows modellers to analyze parameters when simulating the ABL • Accurate fit upstream, some discrepancies at the hilltop and downstream • No similar experiments has been made on highly complex terrain • This analysis: • Revises some Askervein strategies (2 equations k-ε closure) for non-complex terrain • Checks how they work in a more complex terrain site • Configuration: ‘universal or site dependent?’
Turbulent viscosity VON KARMAN INSTITUTE FOR FLUID DYNAMICS 2. TURBULENCE MODELLING OF THE ABL 2.1 Standard k-ε model • Original model. Launder Spalding (1972) • Reasonable accuracy in the freestream • Approximation of ‘wall functions’ for the near wall region Turbulent kinetic energy K Turbulent dissipation rate ε Production of turbulence DEFAULT constants (Launder & Spalding)
VON KARMAN INSTITUTE FOR FLUID DYNAMICS 2. TURBULENCE MODELLING OF THE ABL • Modified constants I.
VON KARMAN INSTITUTE FOR FLUID DYNAMICS 2. TURBULENCE MODELLING OF THE ABL 2.2 RNG k-ε model • Renormalization group theory (RNG) • Additional term in ε equation related to rapidly strained flows at areas of strong curvature Turbulent dissipation rate ε If decreases, the production of ε increases locally to counteract the over-production of k (Gk) If the mean strain tensor Sij increases in areas of strong curvature, RNG decreases Inverse effective Prandtl number for high-Reynolds numbers RNG constants
VON KARMAN INSTITUTE FOR FLUID DYNAMICS 2. TURBULENCE MODELLING OF THE ABL 2.3 Realizable k-ε model • New formulation for the turbulent viscosity ratio involving a variable C where • A new transport equation for the turbulent dissipation rate ε Upper value of (associated to the generation of ε) limited by the mean strain tensor Realizable constants where
WIND VON KARMAN INSTITUTE FOR FLUID DYNAMICS 3. ALAIZ TEST SITE 3.1 General Description • 4 kilometers long, complex terrain hill site (north RIX = 16%) • Prevailing wind direction: north • Roughness description • Clear terrain outside the hill z0=0.03 • Forest inside the hill z0=0.4 3.2 Wind data for validation • 3 meteorological masts: Alaiz_2 (20/40m), Alaiz_3 (30/40/55m), Alaiz_6 (20/40m) • 10 min-average periods, 3 sec sampling rate • Wind speed • Wind direction • Standard deviation of wind speed • Measurement campaign: 1 year • Only considering: data from north (20º sector)
Alaiz_3 Alaiz_2 Alaiz_6 VON KARMAN INSTITUTE FOR FLUID DYNAMICS 4. SIMULATION FEATURES 4.1 COMPUTATIONAL DOMAIN • Structured mesh, 3.65 Million Hexas • Dimensions: 9x9 km2 • Horizontal resolution: 20x20 m on site • First cell height: 0.5 m Set up • Incompressible air, steady-state, RANS • Thermal effects neglected • Discretization: 2nd order upwind • Boundary conditions: • North inflow boundary: Velocity inlet • Southern outflow boundary: Pressure outlet • Eastern/western/top: Symmetry • Terrain surface: Wall
VON KARMAN INSTITUTE FOR FLUID DYNAMICS 4. SIMULATION FEATURES 4.2 Wall functions:Link between the first cell in the vertical direction and the wall Roughness modeling • Fluent Law-of-the-wall modified for roughness Smooth wall Roughness Blocken et al. (2007) ks+: Roughness Reynolds Number (Dimensionless roughness height) Fluent roughness parameters: Cs, ks
ABL log-law Wall Function z1 ks z0 VON KARMAN INSTITUTE FOR FLUID DYNAMICS 4. SIMULATION FEATURES • Compatibility with ABL log-law Fluent roughness parameters: Cs, ks ks: Physical roughness height Cs: Roughness constant (0<Cs<1, Cs~0.5) z0: Aerodynamics roughness length z1: Height of first cell Compatibility between ABL log-law and wall function if: Blocken et al. (2007) z0=0.03m ks~0.6m z0=0.4m ks~7.8m Requirement: z1>ks
VON KARMAN INSTITUTE FOR FLUID DYNAMICS 4. SIMULATION FEATURES • Inlet conditions: ABL log-law has to be compatible with the wall conditions, defined by ks and Cs parameters. Otherwise a roughness change will be introduced and the inlet conditions progressively lost Contours of vertical velocity Internal boundary layer Inlet Outlet Simulation in an empty domain: • The outlet roughness depends on the height of the wall-adjacent cell (z1) and the roughness constant Cs.
55M 40M 40M 40M 30M 20M 20M VON KARMAN INSTITUTE FOR FLUID DYNAMICS 5. RESULTS Horizontal evolution LINE A NO DATA AVAILABLE LINE A = Topographical profile (N-S) 40m a.g.l. aligned to Alaiz3 Mean flow Fractional Speed Ratio Vertical evolution DATA AVAILABLE Z (a.s.l.) Speed-up Ratio = HORIZONTAL DISTANCE Horizontal evolution LINE A NO DATA AVAILABLE Normalized turbulent kinetic energy K* Turbulent characteristics DATA AVAILABLE Vertical evolution Turbulent intensity = Numerical cross-validation in wind speed / turbulence intensity
STD_BELJAARS STD LAUNDER_ SPALDING STD_PANOFSKY RNG STD_RICHARDS_HOXEY REALIZABLE VON KARMAN INSTITUTE FOR FLUID DYNAMICS 5. RESULTS 5.1 Mean flow.Horizontal evolution of FSR - LINE A
Z (m) Z (m) Z (m) VON KARMAN INSTITUTE FOR FLUID DYNAMICS 5. RESULTS 5.1 Mean flow. Vertical evolution of speed-up ratios • Vertical profiles in the surface layer (0-100m) • Experimental values: 10 min average ± Standard Deviation σ • Vertical speed-up profiles overestimaded • Minimum mae for STD_L&S, STD_PNF and STD_R&H • Modelled roughness < Real roughness CROSS-VALIDATION (WIND SPEED)
STD_PANOFSKY STD LAUNDER_ SPALDING STD_BELJAARS RNG REALIZABLE STD_RICHARDS_HOXEY VON KARMAN INSTITUTE FOR FLUID DYNAMICS 5. RESULTS 5.2 Turbulent characteristics. Horizontal evolution of K* - LINE A
Vertical profiles in the surface layer (0-100m) Experimental values: 10 min average VON KARMAN INSTITUTE FOR FLUID DYNAMICS 5. RESULTS 5.2 Turbulent characteristics. Vertical Turbulent Intensity evolution Z (m) Z (m) Z (m) TI_Alaiz6 TI_Alaiz2 TI_Alaiz3 • Vertical TI profiles underestimated • Minimum mae for STD_PNF and STD_R&H • Modelled roughness < Real roughness CROSS-VALIDATION (TURBULENCE INTENSITY)
VON KARMAN INSTITUTE FOR FLUID DYNAMICS 6. CONCLUSIONS • TASK: A sensitivity analysis and assessment of isotropic kε turbulence models through field data from Alaiz hill site. • Standard Panofsky and Standard Richards Hoxey set of constants provide globally better results at the hilltop for this configuration of the model. • The results concern the assessment on the hilltop of Alaiz hill site and could differ on the lee side where unsteady flow patterns usually exist.
6. CONCLUSIONS • Further work: • Optimize the code in the near wall region adapting the present wall funtions especially for highly roughed areas. • Undertake a sensitivity analysis on the inlet profiles assessing its impact on the results • Extend the measurement campaign at other locations with Lidar/sonic anemometry • Test anisotropic models like RSM (Reynolds Stress Model). Compare: error decrease to computing time increase • Test modifying the default configuration of RNG and Realizable models. • Investigate RANS-LES hybrid solutions. Compare: error decrease to computing time increase