Trace elements
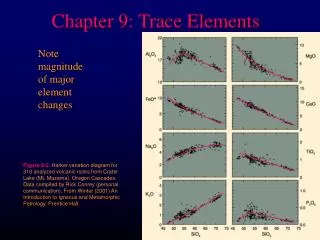
Trace elements. Chapter 2. Why use trace elements?. Note magnitude of major element changes.

Trace elements
E N D
Presentation Transcript
Trace elements Chapter 2
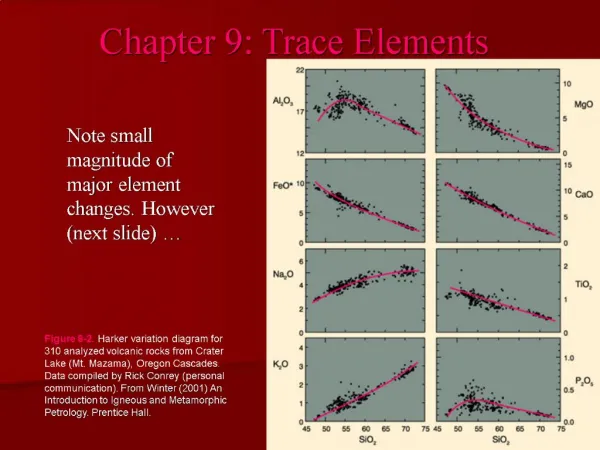
Why use trace elements? Note magnitude of major element changes Figure 8-2.Harker variation diagram for 310 analyzed volcanic rocks from Crater Lake (Mt. Mazama), Oregon Cascades. Data compiled by Rick Conrey (personal communication).From Winter (2001) An Introduction to Igneous and Metamorphic Petrology. Prentice Hall.
Why use trace elements? Now note magnitude of trace element changes Figure 9-1. Harker Diagram for Crater Lake. From data compiled by Rick Conrey. From Winter (2001) An Introduction to Igneous and Metamorphic Petrology. Prentice Hall.
Element Distribution Goldschmidt’s rules (simplistic, but useful) 1.2 ions with the same valence and radius should exchange easily and enter a solid solution in amounts equal to their overall proportions How does Rb behave? Ni?
Goldschmidt’s rules • 2. If 2 ions have a similar radius and the same valence: the smaller ion is preferentially incorporated into the solid over the liquid Fig. 6-10. Isobaric T-X phase diagram at atmospheric pressure After Bowen and Shairer (1932), Amer. J. Sci. 5th Ser., 24, 177-213. From Winter (2001) An Introduction to Igneous and Metamorphic Petrology. Prentice Hall.
3. If 2 ions have a similar radius, but different valence: the ion with the higher charge is preferentially incorporated into the solid over the liquid
CS CL • Partition coefficient: D = Where CS = the concentration of some element in the solid phase
incompatible elements are concentrated in the melt D « 1 • compatible elements are concentrated in the solid D » 1
Compatibility depends on minerals and melts involved. Which are incompatible? Why?
Trace elements strongly partitioned into a single mineral • Ni - olivine in Table 9-1 = 14 Figure 9-1a. Ni Harker Diagram for Crater Lake. From data compiled by Rick Conrey. From Winter (2001) An Introduction to Igneous and Metamorphic Petrology. Prentice Hall.
Incompatible trace elements concentrate liquid • Reflect the proportion of liquid at a given state of crystallization or melting Figure 9-1b. Zr Harker Diagram for Crater Lake. From data compiled by Rick Conrey. From Winter (2001) An Introduction to Igneous and Metamorphic Petrology. Prentice Hall.
If XNi in the system doubles the XNi in all phases will double Because of this, the ratios of trace elements are often superior to the concentration of a single element in identifying the role of a specific mineral
K/Rb often used the importance of amphibole in a source rock • K & Rb behave very similarly, so K/Rb should be ~ constant • If amphibole, almost all K and Rb reside in it • Amphibole has a D of about 1.0 for K and 0.3 for Rb
Sr and Ba (also incompatible elements) • Sr is excluded from most common minerals except plagioclase • Ba similarly excluded except in alkali feldspar
Compatible example: • Ni strongly fractionated olivine > pyroxene • Cr and Scpyroxenes » olivine • Ni/Cr or Ni/Sc can distinguish the effects of olivine and augite in a partial melt or a suite of rocks produced by fractional crystallization
Rare Earth Elements • Lanthanide series • Similar behavior • All +3 charge • Ionic radius shrinks with increasing atomic #
Contrasts and similarities in the D values: All are incompatible Also Note: REE’s are more compatible in felsic, lower-T melts
Contrasts and similarities in the D values: All are incompatible Also Note: HREE are less incompatible (smaller size) Especially in garnet Eu can 2+ which conc. in plagioclase
REE Diagrams Plots of concentration as the ordinate (y-axis) against increasing atomic number • Degree of compatibility increases from left to right across the diagram Concentration La Ce Nd Sm Eu Tb Er Dy Yb Lu
Eliminate Oddo-Harkins effect and make y-scale more functional by normalizing to a standard • estimates of primordial mantle REE • chondrite meteorite concentrations
10.00 8.00 ? 6.00 sample/chondrite 4.00 2.00 0.00 56 La Ce Nd Sm Eu Tb Er Yb Lu 58 60 62 64 66 68 70 72 L What would an REE diagram look like for an analysis of a chondrite meteorite?
10.00 8.00 6.00 sample/chondrite 4.00 2.00 0.00 56 La Ce Nd Sm Eu Tb Er Yb Lu 58 60 62 64 66 68 70 72 L Divide each element in analysis by the concentration in a chondrite standard
Shape of REE plot determines • depth of melting • Minerals left behind (or melted) • % melt
REE diagrams for melting model of a garnet lherzolite for various values of F (% melt): Small % melt, incompatible elements Screaming out of rock Figure 9-4. Rare Earth concentrations (normalized to chondrite) for melts produced at various values of F via melting of a hypothetical garnet lherzolite using the batch melting model (equation 9-5). From Winter (2001) An Introduction to Igneous and Metamorphic Petrology. Prentice Hall.
Europium anomaly when plagioclase is • a fractionating phenocryst or • a residual solid in source Figure 9-5. REE diagram for 10% batch melting of a hypothetical lherzolite with 20% plagioclase, resulting in a pronounced negative Europium anomaly. From Winter (2001) An Introduction to Igneous and Metamorphic Petrology. Prentice Hall.
High and low P melting in mantle • In garnet or plag stability field?
What do these says of source for • Lunar basalt • adakite
Spider Diagrams An extension of the normalized REE technique to a broader spectrum of elements Chondrite-normalized spider diagrams are commonly organized by (the author’s estimate) of increasing incompatibility L R Different estimates different ordering (poor standardization) Fig. 9-6. Spider diagram for an alkaline basalt from Gough Island, southern Atlantic. After Sun and MacDonough (1989). In A. D. Saunders and M. J. Norry (eds.), Magmatism in the Ocean Basins. Geol. Soc. London Spec. Publ., 42. pp. 313-345.
Application of Trace Elements to Igneous Systems 1. Use like major elements on variation diagrams to document FX, assimilation, etc. in a suite of rocks • More sensitive larger variations as process continues Figure 9-1a. Ni Harker Diagram for Crater Lake. From data compiled by Rick Conrey. From Winter (2001) An Introduction to Igneous and Metamorphic Petrology. Prentice Hall.
2. Identification of the source rock or a particular mineral involved in either partial melting or fractional crystallization processes
Shallow (< 40 km) partial melting of the mantle will have plagioclase in the resuduum and a Eu anomaly will result Garnet concentrates the HREE and fractionates among them Thus if garnet is in equilibrium with the partial melt (a residual phase in the source left behind) expect a steep (-) slope in REE and HREE
10.00 67% Ol 17% Opx 17% Cpx 8.00 6.00 sample/chondrite 4.00 2.00 0.00 56 La Ce Nd Sm Eu Tb Er Yb Lu 58 60 62 64 66 68 70 72 10.00 10.00 57% Ol 14% Opx 14% Cpx 14% Grt 8.00 60% Ol 15% Opx 15% Cpx 10%Plag 8.00 6.00 6.00 sample/chondrite sample/chondrite 4.00 4.00 2.00 2.00 0.00 0.00 56 La Ce Nd Sm Eu Tb Er Yb Lu 58 60 62 64 66 68 70 72 La Ce Nd Sm Eu Tb Er Yb Lu Garnet and Plagioclase effect on HREE
Figure 9-3. Change in the concentration of Rb and Sr in the melt derived by progressive batch melting of a basaltic rock consisting of plagioclase, augite, and olivine. From Winter (2001) An Introduction to Igneous and Metamorphic Petrology. Prentice Hall.
Table 9-6 A brief summary of some particularly useful trace elements in igneous petrology Use as a petrogenetic indicator Element Ni, Co, Cr Highly compatible elements. Ni (and Co) are concentrated in olivine, and Cr in spinel and clinopyroxene. High concentrations indicate a mantle source. V, Ti Both show strong fractionation into Fe-Ti oxides (ilmenite or titanomagnetite). If they behave differently, Ti probably fractionates into an accessory phase, such as sphene or rutile. Zr, Hf Very incompatible elements that do not substitute into major silicate phases (although they may replace Ti in sphene or rutile). Ba, Rb Incompatible element that substitutes for K in K-feldspar, micas, or hornblende. Rb substitutes less readily in hornblende than K-spar and micas, such that the K/Ba ratio may distinguish these phases. Sr Substitutes for Ca in plagioclase (but not in pyroxene), and, to a lesser extent, for K in K- feldspar. Behaves as a compatible element at low pressure where plagioclase forms early, but as an incompatible at higher pressure where plagioclase is no longer stable. REE Garnet accommodates the HREE more than the LREE, and orthopyroxene and hornblende do 2+ so to a lesser degree. Sphene and plagioclase accommodates more LREE. Eu is strongly partitioned into plagioclase. Y Commonly incompatible (like HREE). Strongly partitioned into garnet and amphibole. Sphene and apatite also concentrate Y, so the presence of these as accessories could have a significant effect. Table 9-6. After Green (1980). Tectonophys., 63, 367-385. From Winter (2001) An Introduction to Igneous and Metamorphic Petrology. Prentice Hall.
Trace elements as a tool to determine paleotectonic environment • Useful for rocks in mobile belts that are no longer recognizably in their original setting • Can trace elements be discriminators of igneous environment? • Approach is empirical on modern occurrences • Concentrate on elements that are immobile during low/medium grade metamorphism
Figure 9-8.(a) after Pearce and Cann (1973), Earth Planet, Sci. Lett., 19, 290-300. (b) after Pearce (1982) in Thorpe (ed.), Andesites: Orogenic andesites and related rocks. Wiley. Chichester. pp. 525-548, Coish et al. (1986), Amer. J. Sci., 286, 1-28.(c) after Mullen (1983), Earth Planet. Sci. Lett., 62, 53-62.