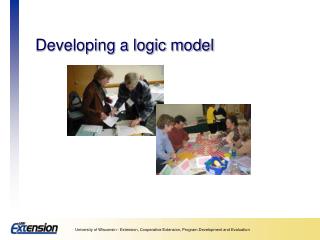
The Logic Model: A Program Performance Framework
The Logic Model: A Program Performance Framework. Steve Wyatt, J.D. Associate Dean, Entrepreneurship & Economic Development College of Engineering Extension Associate Professor Statewide Program Director, Business Development. October 13, 2008. Overarching Direction and Vision. MISSION

The Logic Model: A Program Performance Framework
E N D
Presentation Transcript
The Logic Model: A Program Performance Framework Steve Wyatt, J.D. Associate Dean, Entrepreneurship & Economic Development College of Engineering Extension Associate Professor Statewide Program Director, Business Development October 13, 2008
Overarching Direction and Vision MISSION The Business Development Program’s (BDP) mission is to improve people’s lives and the competitiveness of Missouri businesses through research-based education and technical assistance to enhance Missouri’s economy.
Overarching Direction and Vision Within the next five years, the Business Development program’s vision is to: 1. Be recognized as a leader in the University’s economic development mission and build linkages among students, faculty and businesses to promote research, learning, service, economic growth and quality of life. 2. Be recognized as the national and statewide leader in entrepreneurial development and the creation and growth of small businesses from inception to tomorrow’s enterprise leaders.
Overarching Direction and Vision 3. Become a valued and trustworthy business information source, disseminating business research, resources, training and information for business, policy makers and individuals. 4. Become a market-driven organization that serves entrepreneurs, businesses and Missouri’s workforce with customer-focused programs that are fundablefrom program revenues, donations, grants and stakeholders.
Overarching Direction and Vision 5. Be recognized for our training and learning innovations that effectively use students, businesses, faculty, technology and staff to enhance the learning process for clients and the economy of Missouri.
Operating Principles and Values Organizational Values • Customer Focus • Stakeholder Value • Learning Organization • Respect • Results • Innovation
Reality • What gets measured gets done • If you don’t measure results, you can’t tell success from failure • If you can’t see success, you can’t reward it • If you can’t reward success, you’re probably rewarding failure
If you can’t see success, you can’t learn from it If you can’t recognize failure, you can’t correct it If you can demonstrate results, you can win public support Osborne and Gaebler, 1992 in MQ Patton, 1997:14
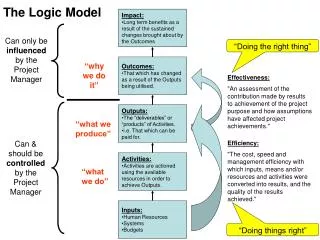
Why Logic Models – Why the Hype? • Shows the difference between what we do and the impact we have • Provides a common vocabulary • Focus on quality and continuous improvement
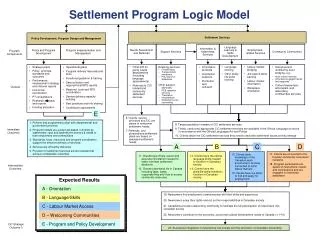
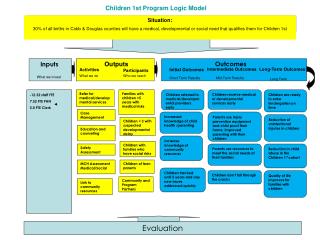
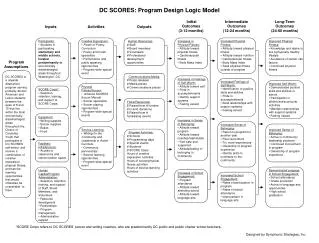
LOGIC MODEL: Program Performance Framework OUTCOMES OUTPUTS INPUTS Short Medium Long Term Activities Participation S What the What the What the ultimate I What we invest What we do Who we reach short term medium term results are T results are impact(s) is U Impact Staff Workshops Participants Learning Action Volunteers Meetings Customers A Time Counseling Citizens Awareness Behavior Practice Decision- making Policies Social action Social Economic Civic Environmental T Money Facilitation Knowledge Materials Assessments Attitudes I Equipment Product dev. Skills Reactions Satisfaction Technology Media work Opinions O Partners Recruitment Aspirations Training N Motivations ASSUMPTIONS 1) ENVIRONMENT 2) 3) Influential factors 4) University of Wisconsin-Extension Cooperative Extension, E. Taylor-Powell, 1998, Business Development Programs
Situation • Situational analysis • Need • Research on Entrepreneurship and Small Business • State, Region and County Needs Identification and Plan of Work • Learning Preferences Research • High Growth Research • Technology Based Economic Development • ttp://www.missouribusiness.net/bridg/time_attitudes_report.pdf • http://extension.missouri.edu/staff/2007-2011_MU_Extension_Plan_of_Work-9-19-06.pdf • http://www.missouribusiness.net/bridg/lep_total_final_report.pdf • Not yet available on line • http://www.missouribusiness.net/bridg/tech_company_needs.pdf
Sample Needs Identification • Understanding the Entrepreneur • BRIDG Research Learning Preferences & Experiences http://www.missouribusiness.net/bridg/lep_total_final_report.pdf
Situation (continued) • Engage others • Stakeholder Input • Customer Input • Problem analysis • Priority setting/goals • Regional Meetings
INPUTS Field Faculty – 39.8 FTE Leadership/Administration – 9.15 FTE Money – $4,500,000 Program Time – 40,596 hours Partners • 9 partner Institutions • Chambers, MEDC, Financial Institutions • SBA, EDA, DET, State of MO, Kauffman Facilities Technology -webCATS, webAPPS, Portal, survey tools
OUTPUTS What we doWho we reach • ACTIVITIES • Training • 807 trainings • 8,025 hours • Counseling • 8,579 sessions • 17,072 hours • Product Development • 4 workgroups • Online Training • 276 trainings • *Abrams & Hill website awards • PARTICIPATION • Training Attendees- 10,733 • Clients – 2,430 • Online Attendees - 1,253 • Hits on web site- 16,230,000 • SATISFACTION • -Revenue generation • $500,000 • Overall Training • 6.3/7 • Instructor Effectiveness • 6.7/7
OUTCOMES What results for individuals, businesses, communities • LEARNING • Short • Gain in Knowledge 1.22 / 5 • Would Recommend 96% • Was it practical 6.17/7 • ACTION • Medium • Business start 182 • Failures prevented 143 • Actions taken 982 • IMPACT • Long • Increase in Sales $204 million • Equity $102 million • Jobs Created 2,449 • Research Funding $9.4 million
OUTCOMES Learning Action Impact PLANNING INPUTS OUTPUTS • Programmatic • investments Activities Participation Satisfaction EVALUATION
Truman State University Northwest Missouri State University NMSU Chillicothe Macon County Extension Office Holt County Extension Center NMSU St. Joseph Monroe County Extension Center Clay County Extension Center Audrain County Extension Center UMKC MU UMSL Kansas City Cass County Extension Center Columbia St. Louis City St. Charles County Extension Center St. Louis County Extension Center Cole County Extension Center University of Central Missouri Camden County Extension Center Phelps County Extension UMR Missouri Southern State University Madison County Extension Center Springfield Cape Girardeau County Extension Center Missouri State University Southeast Missouri State University Greene County Extension Center MSU –West Plains Taney County Extension Center Howell County Extension Center Locations - 2007
Evaluation • Using data to track through PLM • Output • Activities, Participants, Satisfaction • Outcomes • Learning, Action, Impact • Decision making at the lowest level • Ability to “drill down” and manage
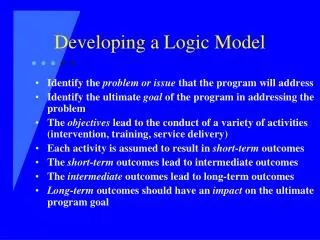
Check Your Logic Model • Are the outcomes really outcomes? • Is the longest-term outcome • Meaningful? • Logical? • Realistic? • Does it represent the program’s purpose; response to the situation?
Thank you! QUESTIONS