Download
1 / 91
910 likes | 1.05k Views
This overview, presented on October 30, 2008, explores whether Nova Scotia is making genuine progress across various sectors, essential for future generations. Key themes include health, well-being, economic valuation of social and environmental assets, and community strength. The Genuine Progress Index (GPI) uniquely integrates economic, social, and environmental dimensions into its accounting framework, allowing for a comprehensive assessment of progress. Trends such as employment, income inequality, and ecological impacts over the last two decades are analyzed, highlighting areas of improvement and decline.

E N D
Genuine Progress Index for Atlantic CanadaIndice de progrès véritable - AtlantiqueIs Nova Scotia Making Genuine Progress? An Overview of Some Key Trends Halifax, 30 October, 2008
Defining Genuine Progress • Are there consensus values on the kind of Nova Scotia we want to leave our children? • Health and wellbeing, safety and security, decent living standards, educated populace, access and inclusion, healthy environment and natural resources, strong and caring communities • Beyond ideology
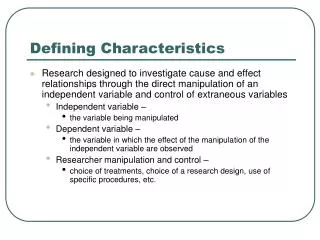
From indicators to accounts • What distinguishes GPI from other wellbeing indicator systems = adds economic valuation component -> moves towards accounting system • = In line with 5 capitals in OSP, which recognizes that social, human, and natural capital also have value ->accounting framework • And EGSPA: Recognizing “the economic value of Nova Scotia’s environmental assets is essential to our long-term prosperity.”
-> A new accounting system • This new accounting framework allows assessment of full economic, social, and environmental costs and benefits, & of cost-effectiveness of alternative policy options • vs existing accounting system: Social, human, natural capital ignored; and their depletion misleadingly measured as gain; + anything can make economy grow regardless of OSP/Weaving Threads goals
A mixed picture • Improvements in employment, real income, income equity (inclusion), poverty reduction, provincial debt status, waste and air quality (20-year timeline), smoking rate, GHGs….. • Declines or insufficient progress (in relation to targets) in agriculture, forests, fisheries, ecological footprint, energy shift, wealth equity, obesity, volunteering, student debt.…. • Just a few examples follow:
Official unemployment rates, Canada and Nova Scotia, 1976-2007
Official unemployment rates by region, Nova Scotia, 2001 to 2007
Disposable Household Income (Richest : Poorest 20%) Canada and Provinces, 1981-2004 ($2004)
Average disposable (after-tax) economic family income by quintile, adjusted for family size, Canada and Nova Scotia, 1976-2006 ($2006)
Prevalence of low income after tax (92 LICOs base), total population, Canada and Nova Scotia, 1997-2006
Prevalence of low income after tax (92 LICOs base), selected groups, Nova Scotia, 1997-2006
Gini coefficients of after-tax income, all family units (economic families and unattached individuals), Canada and provinces, 1981 to 2004
Civic and voluntary work, average hours per year, total population, 15 years and older, Canada and provinces, 1992, 1998, and 2005
Free Time, Nova Scotia and Canada, 1992,1998, 2005 (hours per day)
Share of population indicating high time stress, NS and Canada, 1998 & 2005
Crime rate, total incidents per 100,000 population, Canada and Nova Scotia, 1962-2007
Crime rate comparison: NS and Canada rates of increase, 1962-2007 (1962=100)
Crime rates (per 100,000 population), by offence breakdown, Nova Scotia, 1962-2007 Crime cost = $700 million/year +
Youth crime rate per 100,000, aged 12-17, Canada, provinces and territories, 2006
Change (Percent) in Total After-Tax Income (1999–2004) and Median Debt Value (1999–2005), Canada
Net Worth by Wealth Quintile ($ Trillions, 2005 Constant $), Canada, 1999 and 2005
Share of Wealth (Percent), by Net Worth Quintile, Canada, 1999 and 2005
Percentage Decline in Tobacco Use, Canada & Provinces, 1999-2005
Overweight and obesity rates by province, children, aged 2 -17, 2004
Percentage of population aged 12 and over diagnosed with asthma, both sexes, Canada and provinces, 2007
Average amount of government student debt at time of graduation ($2000 CDN), Classes of 1990, 1995, and 2000, Canada
Percentile scores of correct answers to general political knowledge questions, by age group, 1984, 1993, 1997, 2000
Total Net Farm Income, Nova Scotia, 1971–2007 (millions of $2007)
Expense to Income Ratio (%), Nova Scotia Farms, 1971–2006
Total Net Farm Income and Total Debt, NS Farms, 1971-2006 (millions of $2007)
Debt to Net Income Ratio, Nova Scotia Farms, 1971–2006
Solvency Ratio, Nova Scotia, QC, and Canadian farms, 1971–2006
Value of cod stocks, Eastern Scotian Shelf region, 1972-2002, (2007$ millions).
Mean trophic level (weighted by landed weight) in Nova Scotia Fisheries, 1972-2007
Estimated total biomass of porbeagle shark in the northwest Atlantic, 1961, 1991 and 2001
Total area harvested and area clearcut, Nova Scotia, 1975-2005, (hectares)