Download
1 / 32
320 likes | 744 Views
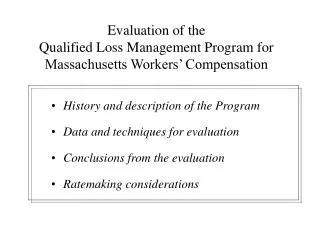
Evaluation of the Qualified Loss Management Program for Massachusetts Workers’ Compensation. History and description of the Program Data and techniques for evaluation Conclusions from the evaluation Ratemaking considerations. Background: Massachusetts Workers’ Compensation.

E N D
Evaluation of the Qualified Loss Management Program for Massachusetts Workers’ Compensation • History and description of the Program • Data and techniques for evaluation • Conclusions from the evaluation • Ratemaking considerations
Background: Massachusetts Workers’ Compensation Situation in 1990: • Residual market had 46% of premium and the share was climbing rapidly • Residual market burden was 40% • No rate differential in residual market Estimated Ultimate Loss Ratio (on 2/14/98 rate level)
Purpose of the QLMP • Reduce workers’ compensation losses through loss control techniques • Provide premium credits to employers as participation incentive • Encourage regrowth of voluntary market by stabilizing and improving experience
Began Nov. 1, 1990 Applicable to Assigned Risks only Maximum credit of 10% Up to 3 years of credit if stay in Program; reduced to half in 3rd year, as improved experience (or failure to improve) is reflected in employer’s experience rating mod Administered by Workers’ Compensation Rating and Inspection Bureau of Mass. Original provisions of the QLMP
May keep receiving credits if removed from Assigned Risk Pool and written in voluntary market (1/1/93) Maximum credit of 15% (1/1/93) 4th year of credit available, at one-quarter of full value (1/1/94) Current provisions of the QLMP
Structured approach to safe work practices (management commitment; employee safety committee) Action plans for post-injury response (relationship with medical providers; continuing case management) Early return to work provisions (modified / light duty) Requirements for a loss management firm’s program to be certified for QLMP
Credit level is determined by which loss management firm is hired by the participating employer Based on loss reduction success for current and former clients, calculated from their experience rating data Recalculated annually by Bureau New firms may offer 5% credit until enough client data accumulate Credit level applies to each client of the firm, if firm certifies full QLMP participation Determination of QLMP credit
Premium and credits in the QLMP • Figures for recent years are understated due to delays in credit applications and audits. Aggregate premium of participants ($M) Credits applied ($M)
QLMP participants Number of participants (policies with credit) Premium size of participants ($000) * preliminary, as of 7/15/97
QLMP credits As of 7/15/97, 8,258 policies had received a credit. Average credits: 1st year 8.8% 2nd year 10.5% 3rd year 6.6% 4th year 3.7% • Majority of 1st-year credits were earned before 1/1/93; maximum credit was 10% • More of 2nd-year credits were earned after 1/1/93, when maximum was raised to 15% • Almost all of 3rd-year, and all of 4th-year, were earned after 1/1/93 • Most loss management firms were qualified to offer the maximum credit . . . • . . . Most employers hired firms who could get them the maximum!
Compare the aggregate loss ratio change for QLMP participants to that for nonparticipants For participants, measure change from year prior to participation to Year 1 (or Year 2 or 3) in the Program For nonparticipants, measure change over that same time period Evaluation of the QLMP
Example: Evaluation for First-Year Credits during 9/1/90 - 8/31/91
Example, continued(1st-year credits during 9/90 - 8/91) • QLMP participants showed 13% more improvement than non-QLMP risks (total market) • Studied one-year periods separately due to changing Mass. WC environment
“QLMP dataset” consists of Unit Statistical Plan (USP) experience for most QLMP participants during the period 9/1/90 through 8/31/94 Standard Premium and Manual Premium for the Year 1 (first credit) policy, Years 2 and 3 if applicable, and the Prior policy (immediately before the Year 1 policy). Adjusted for rate changes. Incurred Losses for each of those policies, valued at 1st report (18 months from policy effective date) and at later reports if available Data used for evaluation: Participants
From Experience Rating system (USP data) at Bureau Voluntary and Assigned Risks, or Assigned Risks only Standard Premium, Expected Losses, and Incurred Losses for policies with time periods matching those of QLMP dataset Expected Losses ( = Payroll/100 x Expected Loss Rate) as proxy for Manual Premium ( = Payroll/100 x Manual Rate) Data used for evaluation: Nonparticipants
Example, comparing to Assigned Risks(1st-year credits during 9/90 - 8/91)
Effects of comparison choices • Assigned risk market also improved over these time periods but not as much as voluntary market • Thus QLMP risks showed greater improvement over non-QLMP assigned risks than over non-QLMP total market risks • In each time period, QLMP risks started with a higher aggregate loss ratio than non-QLMP assigned risks • Using manual premiums and expected losses instead of standard premiums produced similar results
Does improvement persist as losses mature beyond 1st report? Does improvement continue with ongoing participation (Years 2 and 3) in the Program? Does improvement vary by size of insured or experience mod? Does ongoing participation affect loss development? Additional questions
Improvement is sustained as losses mature • QLMP participants showed 13% more improvement at 1st report and 14% more improvement at 3rd report than non-QLMP risks. (First-year credit period 9/1/90 - 8/31/91; loss ratios are to on-level Standard Premium.)
Improvement continues with ongoing participation in QLMP • Participants showed greater loss ratio improvement in each year of participation than non-QLMP risks over the same time periods
QLMP results by Experience Modification “Mod” = Standard Premium in Year 1 / Manual Premium in Year 1 • Higher mods correspond to higher loss ratios (as appropriate) • Average premium size in each group was about the same (not a confounding factor)
Effect of continuing participation on loss development • Continuing participation appears to ameliorate loss ratio deterioration • Similar results seen at 3rd report for these groups • However, continuing participants had significantly higher aggregate loss ratio in first year than non-continuing
Effect of continuing participation on loss development, continued • Continuing participation did not seem to ameliorate deterioration of loss ratios • Overall, no strong conclusion?
Summary of QLMP Evaluation • QLMP participants in their first year showed improvement of 21% over the baseline total market improvement in Loss Ratio • QLMP participants started with a substantially higher aggregate loss ratio than the market as a whole, but the gap narrowed dramatically -31% -12%
Reflection of QLMP Impact in Ratemaking • Premiums and losses • Loss trend • Loss development
Premiums and losses for loss ratio method • Standard Premiums do not reflect QLMP credits. • Adjusted for development, rate changes, and exposure trend, which would not be affected by the Program. • Reported incurred losses do reflect QLMP improvement. • Adjusted for law changes (not affected) and development and trend (discussed below). • Loss ratios are therefore lower due to QLMP. • Assumed to be permanent improvement which would persist into period for which rates are being made. • Therefore, no adjustments necessary.
Impact of QLMP on loss trend • Ratemaking must incorporate long-term trend in the absence of new programs or other one-time effects. • QLMP improvement is already reflected in reported losses; letting it flow into trend calculation would be double counting. • Adjust each year’s loss ratio to where it would have been in absence of QLMP, putting all years on same basis.
Adjustment of loss trend calculation for QLMP effect • Example: assume that for a certain year in the trend period • 15% of Standard Premium comes from QLMP participants • QLMP reduced participants’ losses 20% below where they would have been • Multiply that year’s loss ratio by ( 1 - 15% ) + 15% / ( 1 - 20% ) = 1.0375 • In times of changing workers’ compensation environment, important to assess extra impact of Program.
Impact of QLMP on loss development • In theory, case management or return-to-work programs could temper deterioration of loss ratios. • Conversely, loss ratios could deteriorate rapidly once employer leaves QLMP. • This evaluation was inconclusive. • Longer-term study would be required.
Applying evaluation techniques to similar ratemaking problems • Any loss control program • Ideally need complete, uniform data such as USP • Tort law reform passed by state legislature • Control group to contrast with? States with similar frequency / severity distributions for liability claims.