Download
1 / 17
170 likes | 192 Views
Analysis of RGGI's modeling results on carbon caps, gas price scenarios, emissions projections, and economic impacts in various regions. Includes conversion of wholesale to retail prices and considerations for federal carbon policies. Results show modest impacts.

E N D
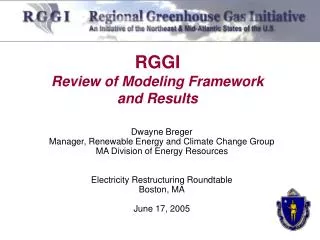
RGGI Review of Modeling Framework and Results Dwayne Breger Manager, Renewable Energy and Climate Change Group MA Division of Energy Resources Electricity Restructuring Roundtable Boston, MA June 17, 2005
IPM® New England – 10 Model Regions Based onISO-NE RTEP Definitions ME VT NH CMA/NEMA (Central / Northeast Mass) BOSTON SEMA (Southeast Mass) WMA (Western Mass) CT RI Southwest CT / Norwalk
The State Working Group has adopted a gas price trajectory phasing from a 3-year moving trend of EEA’s trajectory in the near-term to a long-term EIA trajectory. These commodity prices are converted into delivered prices based on EPA seasonal and regional transportation adders. These adders are for the Reference Case(s). The adders are not assumed to change over time. Reference Case Natural Gas Price Forecast Henry Hub Gas Price (2003$/MMBtu)
Summary of Model Runsto be Presented • Reference Case (BAU) • Carbon Caps • Stabilization at Current (2006) Levels • 10% below Stabilization by 2020 • Without and With Federal/Canadian Carbon Policy (stabilization at 2015)
Additional Model Runsto be Considered • High Gas Price Scenario • “Packaged” Program - inclusive of • Energy Efficiency measures • Offsets program • Price Trigger for CDM allowances
Projected BAU CO2 Changes MA and NEPOOL emissions are projected to grow more slowly than the region as a whole.
Wholesale to Retail Price Conversion Example: IPM Ref Run Wholesale Electric Price Output for MA in 2015 = $43.9 / MWh Conversion Factor1 (New England, Commercial, 2015) = 1.7 Therefore, Retail Commercial Electricity Price in MA = $74.7 / MWh REMI Input: REMI receives retail energy prices as a factor relative to a national average price. The computed retail prices are converted to these factors maintaining their relative magnitudes across sectors, states, and time. 1 Conversion Factors are determined for each state and for each year. Source for Conversion Factors: End-use Energy Prices by Sector & Source, (http://www.eia.doe.gov/oiaf/aeo/supplement Tables 11,12, 20).
Increase in Retail Energy Prices – Year 2015 Based on IPM Wholesale price changes converted to Retail price changes (pre-REMI modeling) • Under the Stabilization and 10% below Stabilization caps, retail electricity prices rise with carbon Allowance prices, but generally stay well below a 5-6% increase through 2021. • Under the cap scenarios with a federal/Canadian carbon policy (starting in 2015), retail electricity prices rise more significantly in the latter years, but RGGI region prices remain (or become more) competitive relative to the country as a whole. Results are prior to consideration of any program Flexibility Mechanisms
Summary of Regional Economic Impacts (%) Impacts are relative to Reference Run and aggregated across RGGI Region Economic impacts are small – generally well below one-tenth of 1% change in economic indicators. Impacts increase with cap size, but decrease when a Federal program is assumed. Results are prior to consideration of any program Flexibility Mechanisms