Project Management Concepts
60 likes | 109 Views
Explore essential project management tools like Gantt chart, PERT analysis, and Critical Path to optimize task timing and sequencing. Learn how to draw Gantt & PERT charts, calculate task time, and identify critical paths.

Project Management Concepts
E N D
Presentation Transcript
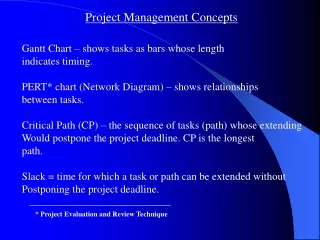
Project Management Concepts Gantt Chart – shows tasks as bars whose length indicates timing. PERT* chart (Network Diagram) – shows relationships between tasks. Critical Path (CP) – the sequence of tasks (path) whose extending Would postpone the project deadline. CP is the longest path. Slack = time for which a task or path can be extended without Postponing the project deadline. * Project Evaluation and Review Technique
Estimating Task Time O = optimistic time P = pessimistic time R = realistic time
Skills Needed: • Draw Gantt & PERT with MS Project • Draw PERT manually based on requirements • Calculate Task Time (“expected time”) • Figure out Critical Path and slack (simpler questions)