Download
1 / 30
300 likes | 335 Views
Learn how ATP bioluminescence testing can assess cleanliness in restaurants, reducing microbial risks and improving sanitization. This study evaluates ATP monitoring on food contact surfaces and its impact on cleaning standards.

E N D
Assessment of ATP Bioluminescence monitoring in restaurants Paul B. Allwood, PhD, MPH, RS Minnesota Department of Health St. Paul, Minnesota
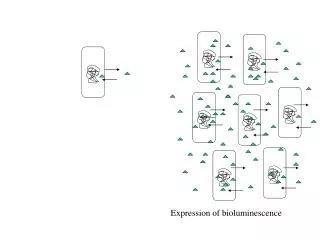
How fireflies produce light • Luciferase/luciferin • Oxygen • ATP
ATP Bioluminescence test kits • Collection • Single use swabs (cotton or foam) • ATP releasing agent • ATP detection/quantification • Self-contained enzyme and co-factor • Luminometer • Data handling
Concept • Clean food contact surfaces • Little or no ATP • Easier to sanitize • Decreased microbial risk • Unclean food contact surfaces • High levels of ATP • Harder to sanitize • Significant microbial risk
Cleaning standards for food contact surfaces (FCS) • Goal • Remove organic matter • FCS for PHF/TCS • As often as necessary • Once every four hours • Related to temperature • Clean to sight and touch
Food Contact Surface (FCS) • A surface of EQUIPMENT or a UTENSIL with which FOOD normally comes into contact; or (2) A surface of EQUIPMENT or a UTENSIL from which FOOD may drain, drip, or splash: (a) Into a FOOD, or (b) Onto a surface normally in contact with FOOD. 2005 FDA Model Food Code
Transient microbes on FCS • From raw materials • Humans • No history of establishment • Controlled by routine cleaning and sanitizing • E.g. Shigella and Campylobacter
MDH study • Pilot study to: • Assess utility of ATP testing • Determine failure rates of visibly clean FCS • Assess effect on failure of: • Menu • Method of warewashing • Type of equipment/utensils
Method • Samples collected in selected restaurants • Based on menu • Willingness to participate • Clean equipment and utensils sampled • Manufacturers instructions • Initial field trial • Zig-zag swabbing (east/west and north/south)
Pass/fail • Hygiena instructions • ≤ 30 RLUs (clean) • >30 and ≤ 300 RLUs (caution) • >300 RLU (unclean) • MDH study • ≤ 30 RLUs (pass) • > 30 RLUs (fail)
Data analysis • Summary statistics calculated for RLUs • Pass/fail frequencies calculated • Chi square significance • Data analyzed with: • version 3.3.2 EpiInfo software • SAS Enterprise Guide 3
Results summary • 137 out of 493 (28%) FCS failed • Failure rates varied with surface • Menu associated with failure • Warewashing associated with failure • Cutting boards and slicers worst • Cups and plates were best
ATP results by menu Chi-square 7.32; p-value 0.03
Manual High Temperature Low temp Failure rates by warewashing method 33% 46% 21% Chi-square 22.7; p-value < 0.0001
Mean RLU levels by FCS type 30 RLU
Discussion • Monitoring FCS cleaning is beneficial • Assess food contamination risk • Identify problems with cleaning protocols • Training • Cutting boards and slicers • Inadequate cleaning effort • Too hard to clean
Limitations/challenges • Only one system tested • Lack of background information • Lack of standard plans for sampling • ATP signal decay • Pass/caution/fail criteria
ATP monitoring of FCS cleaning • Why • Detect cleaning failure • Focus cleaning/training efforts • Where • Sites with direct contact with RTE foods • Sites most likely to reflect cleaning failures • How often • Based on knowledge of the operation • Economics
Acknowledgements • MDH staff • Gary Edwards • Pam Steinbach • Steven Diaz • University of Minnesota • Dr. Daniel Dodor