Download
1 / 28
280 likes | 407 Views
This presentation by Robert Edson of Altarum outlines the scientific information needs assessment for the North Slope of Alaska conducted on January 26, 2004. It covers background information, data requirements, the role of remote sensing, traditional knowledge integration, and cumulative impacts studies. The goal is to evaluate information accessibility and enhance communication pathways among various agencies, organizations, and local stakeholders. The document also discusses existing baseline data, relevant agencies, and organizations involved, ensuring comprehensive coverage of the region's environmental needs.

E N D
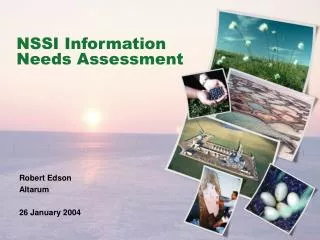
NSSI Information Needs Assessment Robert Edson Altarum 26 January 2004
Map courtesy of North Slope Borough Presentation Outline • Background • Data Requirements • Remote Sensing • Animals/Plants • Traditional Knowledge • National Academy Cumulative Impacts Study • Assessment Support Tools
Ice wedge polygons, image courtesy of USWFS NSSI Information Needs Project • Goal • To do a high level assessment of scientific information needs for the North Slope of Alaska. • To establish infrastructure and communication pathways to support the continued exchange of information. • Definition: • Need - assessed based on both information availability as well as accessibility. • Process • Interviews • Literature surveys • Limited site visits
Agencies/Organizations Active in the Region(representative list) • Federal • Environmental Protection Agency • Department of Agriculture • Department of Energy • Department of the Interior • Bureau of Land Management • Fish and Wildlife Service • Minerals Management Service • National Science Foundation • Department of Defense • National Park Service • US Geological Survey • Army Corp of Engineers • National Oceanographic and Atmospheric Agency • National Aeronautics and Space Agency • National Marine Fisheries Service • National Geospatial Intelligence Agency • US Arctic Research Commission • State • Department of Environmental Conservation • Department of Fish and Game • Department of Transportation • Department of Natural Resources • Non-Governmental • Barrow Arctic Science Consortium • National Audubon Society • The Wilderness Society • The Nature Conservancy • Sierra Club • Ducks Unlimited • Resource Development Council • Alaska Center for the Environment • ARCUS • Industry/Consultants • ConocoPhillips • BP Alaska • Tesoro Alaska Company • Unocal • ExxonMobil • Chevron/Texaco • Anadarko Petroleum Corporation • Alyeska Pipeline Services Company • Petro Star, Inc. • Alaska Oil and Gas Association • Total E&P USA • Pioneer Natural Resources • Braund and Associates • ABR, Inc. • AeroMap, Inc. • Alaska Research Associates, Inc. • Enxtrix • ENSR International • Encana • Local • North Slope Borough • Arctic Slope Regional Corporation • Inupiat Community of the Arctic Slope • Alaska Federation of Natives • Academic • University of Alaska • University of Tennessee • University of Washington • Barrow Arctic Science Consortium • The Ecosystem Center, Marine Biological Laboratory • Many other Universities and Institutes
Baseline Data with Desired Temporal and Spatial Scales (Draft)
Baseline Data with Desired Temporal and Spatial Scales (Draft)
Baseline Data with Desired Temporal and Spatial Scales (Draft)
Toolik Lake, image courtesy of Arctic LTER Milepost 0 of Trans-Alaska Pipeline and gravel pad, Prudhoe Bay, image courtesy of NAS GIS/Data Holdings (Representative Listing) • Alaska Geospatial Data Clearinghouse • Barrow Area Info Database-IMS • Alaska DNR – Division of Oil and Gas • Alaska Geobotany Center • Toolik Field Stations GIS • Bureau of Land Management – Northern Field Office and State Office • USGS Arctic Science Center • USGS - Alaska Digital Geologic Map Database • The Nature Conservancy - Ecoregion Study • Fish and Wildlife Service • US Geological Survey • Geographic Information Network of Alaska (GINA) • North Slope Borough – Planning and General Slope information • UAA/CRREL – Sea Ice Atlas • ConocoPhillips • BP • LGL – Oil industry and Human activity in Beaufort Sea • Numerous Research Specific Activities
Major Slope Data Layers- Current Status • Infrastructure • Metadata on the available infrastructure maps is incomplete, and it is likely that the digital maps of pipelines and transmission lines are at a relatively coarse scale. We have good maps of roads, as of 2002, from the TIGER files. It is unknown if the roads layer has been adequately validated. • Topography • Current DEMs are available from the USGS National Elevation Dataset (NED) (http://gisdata.usgs.gov/NED/default.asp) based on USGS DLGS. The data is a low resolution source grided to a 2-arc-second resolution, which equals about 30 meters in northern Alaska. The precision of the source data determined the NED data precision. In northern Alaska, the data is not well resolved. Some areas of the North Slope have had some additional data collections. Also, some NSF projects have acquired airborne IFSARE data for specific areas. • Hydrology • The current maps are from standard USGS mapping procedures. Much of the NS has been mapped at the coarser 1:250,000 scale. Some areas are mapped at the 1:63,360 scale (inch to a mile). Map updates may not be recent. No validation. • Land Cover • A comprehensive, slope-wide mapping of land cover has been done previously in the late 1970’s using Landsat MSS. Updated in 1990’s but not readily accessible. • Lake depth/freezing • Lake depth and freezing has not been done for the North Slope, aside from a few studies of individual lakes for algorithm development. • Snow cover • Snow cover maps may be available from 2000 to the present from NASA (MODIS Land program). The status and validity of the product is unknown. Historic snow cover (pre-2000) may be derived from passive microwave imagery (SSMI), but the accuracy would be less than MODIS-derived maps. • Freeze/thaw • Freeze/thaw maps derived from SAR may be available from NASA JPL. The status and validity of the product is unknown. • Vegetation/greenness (NDVI) • 15-day composite NDVI products would be the desired product for April to September. Many years of composite data are avail, and a product is currently being made using MODIS. Approx 20 years of 8-km data are not difficult to obtain. 1 km resolution could be compiled, but with some missing years.
North Slope Remote Sensing • Landsat –16-17 scenes required for full coverage of North Slope (see figure). • Landsat MSS from mid 1970’s to 1980 – limited available – mosaic is better • Landsat TM from early 1980’s to 1990’s – limited coverage • Landsat 7 (ETM+) 1999 to 2003 – very good coverage, but sensor problems beginning in 2003 continue at present. • Landsat MSS Mosaic Circa 1978 – Covers entire North Slope, three spectral bands (green, red, near-ir); 50 m pixel spacing. 2 scenes from 1987. • Landsat TM – 4-scene mosaic of Prudhoe Bay and east. 30 m resolution • Landsat ETM+ images of portion of NPRA-northwest – 2 adjacent scenes from 2002 • AVHRR – one or two scenes required for full coverage. Composite data more useful than raw images. • AVHRR composite images – bi-monthly composites of Alaska for summers 1990 to 1992. 1 km resolution. May be available for 1993/4. • AVHRR imagery – available at least 2X per day from 1981 to present – difficult to use “raw” data (see composite images above) • Synthetic Aperture Radar – many data collections from each sensor • ERS-1/2 SAR – 300+ scenes needed for full NS coverage 1991 to present. • JERS SAR – 300+ scenes needed for full NS coverage 1994 To 1998 • Radarsat standard beam – 300+ scenes needed for full coverage • Radarsat ScanSAR – 4 to 6 scenes needed to cover NS 1995 to present • TERRA/AQUA sensors: • MODIS – multi-spectral system – data collected on 2 satellites – at least one morning and one afternoon collection each day. 250m to 1km resolution. Many data products being created (see below). • MISR & ASTER – multi-spectral sensors with small coverage per scene (smaller than Landsat). Targeted collections can be requested as a NASA investigator. • Specific Products • Vegetation index (NDVI/EVI) – MODIS-derived 16-day composite; 250 or 500 m resolution; global product for 2000 to present. • Vegetation index (NDVI) – AVHRR-derived; 15-day composite; 8-km resolution; global product for 1982 to 2000 available. • Snow cover – MODIS-derived; 8-day composite; 500 m resolution; global product, composite used to eliminate clouds. Algorithm is well tested and robust. Combination of MODIS snow cover product with passive microwave (AMSR on AQUA) can yield snow-water equivalent. • Active layer/thaw depth – Data from the CALM project – may not be RS-derived
North Slope GIS/Data Efforts • Good Attributes • Site specific data available • Highly detailed data available • Many data layers are constantly updated • Abundance of GIS related activities in the North Slope • Problems • Incomplete coverage across slope • Slope-wide data is often at a small scale • Major Deficiencies • Metadata missing, incomplete, or in a format not easily imported in ArcCatalog • Many layers are over 10 years old with no plan to update • The NSSI needs a comprehensive GIS for planning and research which is accessible and user friendly. • Targeted at archive and analysis.
Animal/Plant Studies • Significant work has been done. • Studies predominately development region specific or very local in nature. • Concentrated on individual species - snap shot in space and time. • Ecosystem/system perspective not obtained. • Few landscape scale studies.
Traditional Knowledge • Traditional knowledge (from Patricia Cochran, AKNSC) • Practical common sense passed on from generation to generation. • Knowledge of the environment and the relationships between things. • Holistic. It is a way of life. • Several excellent projects to make traditional knowledge more available and to incorporate into decision making. Examples include: • Alaska Native Knowledge Network • MMS Hearing Testimony Transcripts • Projects by Native Science Commission and Institute for Social and Economic Research • Northern Contaminants Program • Difficulties still exist in the application of Traditional Knowledge: • Eliciting and gathering the information • Long term commitment to the collection and collation of the information • Development of applications and methods for efficient information storage and access • Development of tools for the western scientist and manager to use and understand the information
Prudhoe Bay drill rig, image courtesy of Alaska DNR Aerial view of Prudhoe Bay, image courtesy of Alaska DNR National Academy of ScienceCumulative Environmental Effects of Oil and Gas Activities • Committee formed by the National Academies • Reviewed information about oil and gas activities on the North Slope, and assessed the known and possible cumulative impacts of those activities. • Looked at impacts on the physical, biotic, human and marine environments. Evaluated a variety of possible scenarios for the future.
NAS Study Key Findings • Climate Change • Interaction of climate change and oil development. • Source of change in the region is not well understood. • Need for Comprehensive Planning • Currently decisions on industrial activities without a comprehensive plan to guide the process. • Ecosystem Research • Lack of ecosystem-level research in the North Slope. • Offshore Oil Spills • Additional research needed especially in broken ice. • Zones of Influence • Research is required to understand the true zone of influence from industrial activities. • Human Communities • Research is needed that looks at the benefits and threats from industrial activities to the way of life of North Slope communities. • Human-Health Effects • Lack of data on the exact impact of industrial activities on human health in the North Slope.
NAS Study Key Findings (cont.) • Air Contamination and its Effects • Limited historical data for air quality trend analysis. • Off-Road Traffic and the Tundra • Effects of off-road traffic are not completely understood. • Caribou and Bowhead Whales • Need to understand impact of development on caribou on the North Slope, especially in regards to their habitats and reproductive activities. • Effects of noise from offshore activities on the behavior of bowhead whales. • Consequences of Water Withdrawals • Effects of an increase in the use of water from deeper lakes. • Effects of the removal of water from lakes that may not contain fish, but are used by other biota. • Dealing with Uncertainty • Impossible to collect enough data • Difficult to study certain animal species. • Uncertainties in research need to be provided to decision makers to improve the decision making process.
SEARCH Implementation • Arctic System Reanalysis • Detecting and Quantifying Unaami • Social and Economic Interactions • Large Scale Atmospheric Observatories • Distributed Marine Obersvatories • Distributed Terrestrial Observatories • Linkages and Global Couplings • Social Response
Trans-Alaska Pipeline, image courtesy of BLM Trucks spraying water in the construction of an ice road, image courtesy of Alaska Oil and Gas Reporter Assessment and Planning Tools • NSSI Composite Planning GIS • NSSI Portal • Online Citation Database • Online Project Database
Political/Admin. Demographic Infrastructure Cadastral Landmarks Env./Pub. Health Imagery Climatic Topographic Geologic Hydrologic Landuse/Landcover Ecologic NSSI Composite Planning GIS • State Lines • County Lines • Municipality Boundaries • City Boundaries • Native Allotments • Census Tracts, Block Groups, Blocks • 2000 Census Data • Airports/Airstrips • Pipelines • MIRIS (transportation & utilities) • TIGER Line Files • Pump stations • Available for a fee • TIGER Line Files (schools, hospitals, religious centers, etc.) • National Cancer Atlas • Landsat MSS (50m and 100m) • Landsat TM (50m) • SeaWiFS phytolankton chlorophyl concentrations GIS Data • Annual Average Precipitation (1961 – 1990) • Real-Time Weather Stations • USGS DEMs • Elevation Contours • Coastline Bathymetry • Exploratory Oil Wells • Oil and Gas fields • Surficial Geology • Coal Fields • Real-Time Stream Gages • Detailed lakes • TIGER Hydrology • USGS Hydrology • Circumpolar Arctic Vegetation Map • NPRA land cover raster • STATSGO Soils • Ecoregions • Wildlife Data
Website with collected links and information on the North Slope. “One-Stop Shop” for the casual or serious user. Brings together large numbers of disparate data. Invaluable for communication, education, and outreach. Provides enhanced research and collaboration environment. NSSI Portal (www.northslope.org) A unified front end/entry point for all aspects of the initiative… • Online Project Database • Emphasis on Industry and Agency Projects • Online Citation Database • Emphasis on gray and non-traditional literature
Summary • The extent and cause of change in the North Slope region is not well understood. • Baseline data for the region, from species population and dynamics to ecosystem assessments, is incomplete from a spatial and temporal standpoint. • Data management is not sufficiently organized or coordinated to maximize and leverage data use. • Coordination and exchange between researchers is difficult or lacking because there is no user friendly process in place. • Sufficient support infrastructure is not available to fully address these issues.