Download
1 / 26
260 likes | 352 Views
This presentation by Professor Dame Julia King at the National Carbon Reduction Conference in London highlights practical steps at Aston University to cut CO2 emissions by 50% to achieve the global emission reduction target. The transportation sector is crucial, with road transport emitting a significant amount of CO2. The talk discusses the challenges in reducing emissions from cars and vans, emphasizing the need for efficient citizens, cities, and vehicles. Strategies such as eco-driving, enforcing speed limits, and promoting public transport are crucial for achieving emissions reductions in the transport sector. The presentation also addresses the importance of investing in zero emission modes like cycling and walking to promote sustainable transportation. Join the discussion on decarbonising transport for a greener future!

E N D
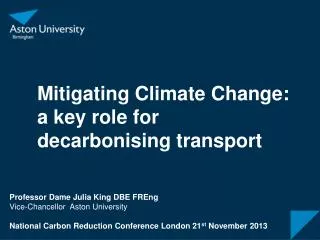
Mitigating Climate Change: a key role for decarbonising transport Professor Dame Julia King DBE FREng Vice-Chancellor Aston University National Carbon Reduction Conference London 21st November 2013
The UK target and transport emissions • Achieving emissions reductions • Practical steps at Aston University
CO2 emission reduction 50% cut in global emissions by 2050 to keep temperature rise to ~ 2o 2050: 22GT global emissions 2100: 9GT 2050: 9 billion people 2.5 tonnes per year each 80% reduction in emissions in UK
The UK’s 2050 target 670 MtCO2e International aviation & shipping* Agriculture non-CO2 Other non-CO2 & LUC 76% cut (=80% vs. 1990) Industry (heat and industrial processes) Residential & commercial heat Domestic transport 159 MtCO2e Power generation * bunker fuels basis
17% global emissions 20% UK emissions 33% US emissions Road Transport 1 billion vehicles globally use 53% of oil produced
Car emissions • In 2050 total CO2eper head needs to be about 2.5 tonnes per annum • An average car today in the UK (160g/km), driven 15,000km per year, emits 2.4 tonnes per annum
The transport challenge: CARS Cars and vans: 73% Source: DECC 2009, 2008 final UK greenhouse gas emissions: data tables
Distance driven Technology Strategy Board
China Efficiency: in congested urban areas, 30-40% of total fuel is used by cars looking for parking The average search time is about 8 minutes Source: MIT c Urban transportation is approximately twice as energy intense as intercity transport Source: Schafer et al MIT Press 2009 Traffic
Achieving CO2 emissions reductions • Efficient Citizens • Efficient Cities • Efficient Cars
‘Movement of people and goods provides vital social and economic benefits’ Vehicle choice: 25 – 30% Eco driving: 15% Speed limits: 10 – 20% Reduced marginal car use Public transport Reduced congestion Efficiency Julia King Aston University Birmingham, UK
Choosing best in class 25 – 30% reduction SMMT 2012 Boxes indicate range where 50% of sales fall
Efficient citizens: 2020 • Committee on Climate Change 2020 • ‘Efficient people’ deliver ~ 22% reduction • Driving behaviour and modal shift ~ 6% saving • Reduced car use - Smarter Choices: reduction in car km of 5 – 7%, saves 3 – 4Mt CO2 • Eco-driving: 10% car & van drivers, 100% HGV drivers, saves 1Mt CO2 • Enforcing the speed limit at 70mph saves 1.3Mt CO2 • Reducing to 60mph would save another 1.45Mt CO2 • Majority from reducing vehicle emissions: average new car emissions 95g CO2/km in 2020
Efficient Cities Calgary 90% of trips are by car Hong Kong less than 20%
City growth of 25% Dispersal 59% smaller change in car passenger km Compaction
The modal shift challenge: door-to-door in Delhi Source: IIT Delhi
Carrots and sticks • But….you need dense cities and carrots and sticks • Carrots: public transport • Frequent • Subsidised • Clean • Secure • Sticks: financial penalties • Vehicle tax • Fuel price/tax • Congestion charging • Limited and expensive parking
Efficient cars available technology can improve ICE vehicle efficiency by 50%: 70g/km Source: King Review HMT 2007, 2008
China 2050 20g/km • Biofuels • Hydrogen • Electricity
Electric cars: emissions 1 UK 2010 2 UK 2020 3 UK 2030 ‘Ultimate ICE’ Effective vehicle emissions (gCO2 /km) 2 1 3 Courtesy David Joffe, Committee on Climate Change 2008
CCC: low-carbon vehicles need to be 60% of new sales in 2030 2030 Average emissions intensity in 2030 New cars purchased: 52g/km (versus 150g/km today) All cars on road: 81 g/km (versus 173 g/km today)
Aston University Travel Action Plan • Education and awareness • Go Green Week • Platinum EcoCampus • Royal Academy of Engineering Visiting Professor of Sustainable Design • Green guide leaflet: local cycle parking and information on cycle routes, bus stops, campus buildings and website links • Active ‘Green Team’ • Encouraging modal shift to public transport • Increasing (salary-related) parking charges • Steadily reducing the total number of car parking spaces • University signed up to car share websites (little uptake), informal car sharing • Dedicated travel information webpages • Aston app for live bus and train departure times, large screen in reception • Improved locations and surroundings of local bus stops
Aston University Travel Action Plan • Encouraging zero emissions: cycling and walking • Investment in cycle parking infrastructure across campus • Changing, showers and lockers for use by staff and students • Aston Bicycle Users Group, staff and students, shares information and promotes cycling • Business cycle mileage encourages staff to travel by bike on University business • Staff benefits: cycle purchase scheme from gross salary – before tax and NI • Discounted “D” locks, cycle scheme membership and promotional events • Shared use paths for cycling and walking including signage and vehicle access restrictions • Increasing on-campus student accommodation to reduce travel demand • Encouraging low emissions vehicles • University electric car available for business trips • Staff benefits: low emissions (˂120g/km) vehicle leasing from gross salary • Charging points for electric vehicles in car parks • Considering introduction of emission-based parking charges
Impact on staff travel to work: 2011/12