Understanding the Local Climate Analysis Tool (LCAT) for Accurate Climate Data
The Local Climate Analysis Tool (LCAT) is essential for analyzing climate data, ensuring that trends are accurately interpreted without artificial biases. It is crucial to utilize datasets that meet specific requirements, such as a minimum 30-year record and low missing data rates. This presentation by Nicole McGavock from the National Weather Service discusses the significance of homogenized datasets, the distinction between raw and adjusted data, and the implications of using station-specific data for decision-making. A comprehensive understanding of data reliability promotes sound climate studies.

Understanding the Local Climate Analysis Tool (LCAT) for Accurate Climate Data
E N D
Presentation Transcript
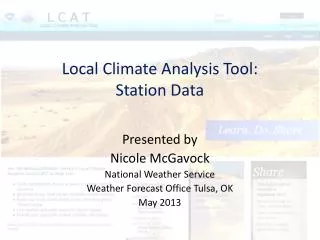
Local Climate Analysis Tool:Station Data Presented by Nicole McGavock National Weather Service Weather Forecast Office Tulsa, OK May 2013
Local Climate Analysis Tool • Analyzing Datais a primary function of LCAT • Important to understand the underlying data used in LCAT climate studies
Need to be sure you are comparing apples to apples • If not, you will introduce artificial biases or trends • Results show a climate signal when one doesn’t exist • Results show a different climate signal than actually exists • Decision makers and partners will plan,prepare,make decisions, and spend money on incorrect assumptions based on these artificial results
Requirements for LCAT Datasets • Continuous data record • Period of record must be at least 30 years long • WMO recommendation • Less than 9 days missing per month • NCDC rule of thumb • Reliable source • Data is documented (metadata), published, and accepted in the scientific community
Temporal Resolution • All datasets are available at monthly and seasonal time scales • Initially data available through 2012 (DJF2013) • Future: data updated monthly • Season = average of 3 consecutive months • Seasonal average is a weighted average • Data available from 1925-Present • Range field requires a minimum 30-year period • Ensures scientifically sound climate studies
LCAT: Available Station Datasets • NCDC Homogenized Dataset • ACIS Dataset • Custom Datasets
Station Data • Point data • LCAT results only applicable to that one location • Over 5,000 NWS COOP stations • Not all COOP sites are available due to missing and/or erroneous data • Station availability can be found through LCAT “help” section about data
Why Use Station Data? • Interest in one specific location • Other variables beyond average temperature and total precipitation are available
NCDC Homogenized Dataset • What is “Homogenized”? • The process of removing systematic changes in the bias of a climate series • NCDC performs several quality control, homogeneity, and adjustment procedures to ensure the dataset is 100% complete and homogeneous for the station’s period of record. • This technique uses the most recent temperature values to adjust the entire dataset • Homogenized data will be DIFFERENT from those found in xmACIS and other sources
Homogenized vs. Raw Data • Inconsistencies in raw data • Time of observation • Station moves or changes in observational environment • Equipment changes • transition from liquid-in-glass thermometers to the maximum–minimum temperature system (MMTS) or ASOS • Inconsistencies can lead to artificial biases and trends • = LCAT results that are not ‘real’
NCDC Homogenized Dataset Data homogenization includes: • Monthly and daily value internal consistency check • Identifies when daily Tmax < Tmin • Identifies when daily Tmax < Tmin on preceding and following days as well for Tmin > Tmax during the relevant 3-day window • Identifies duplication of data and days with Tmax and Tmin are both zero • Identifies temperatures that are at least 10°C warmer or colder that other values for a given month • Identifies daily temperatures that exceed the respective 15-day climatological means by at least 6 standard deviations
NCDC Homogenized Dataset • Bias adjustment to a midnight to midnight observation schedule • Allows for comparison between COOP stations that report at differing times (7am, 5pm) and ASOS (midnight) • Spatial quality control check • Identifies daily temperatures whose anomalies differ by more than 10°C from the anomalies at neighboring stations on the preceding, current, and following days • Identifies monthly temperatures whose anomalies differ by more than 4°C from concurrent anomalies at the five nearest neighboring stations whose temperature anomalies are well correlated with the target (correlation >0.7 for the corresponding calendar month)
NCDC Homogenized Dataset • Adjustments for sensor changes or station moves • Pairwise approach • comparisons are made between numerous combinations of temperature series in a region to identify and remove relative inhomogeneities(i.e., abrupt changes in one station series relative to many others) • Estimates missing or discarded data • Missing values are filled-in with estimated values generated using an optimal interpolation technique known as FILNET (“fill in the network”)
Example of artificial bias/trend Analysis courtesy: Dr. Robert Livezey
NCDC Homogenized Dataset Exception: Precipitation data are not homogenized • Due to nature of rainfall • Can have large gradients temporally and spatially • Raw monthly total precipitation • No time of observation adjustment • Missing values are filled-in with estimate generated using an optimal interpolation technique known as FILNET (“fill in the network”) • Uses precipitation values at neighboring COOP stations
NCDC Homogenized Dataset • Available homogenized data: • Mean temperature • Maximum temperature • Minimum temperature • Total precipitation
ACIS Dataset A collection of federal, regional, state, and local weather and climate networks • Includes NWS and NCDC quality controlled data • Missing data may occur • Includes archive-quality historical data • Includes near real-time data • Same data that is viewed through xmACIS • NOT homogenized
ACIS Dataset • Daily and monthly averages and totals are considered raw data and not recommended for LCAT use • Reminder: raw data can introduce artificial trends/biases • Extremes data CANbe used for LCAT • Especially stations with threaded data • Extremes can be a valuable source of information and can be used for climate studies • ‘Monthly Extremes’ - the hottest (coldest) one day from the month or season
ACIS Dataset • Available ACIS Data - monthly extremes of: • Maximum Temperature • Minimum Temperature • Average Temperature • Precipitation • Snowfall • Snow Depth • Heating/Cooling/Growing Degree Days
Custom Datasets • Future LCAT capability • Custom datasets should meet the requirements for datasets • Continuous data record • Reliable source • Can extend beyond weather variables • Examples: # of thunderstorm days, streamflow, tornadoes, number of days above 100°F, wind speed, sea level height, # of mosquitos carrying West Nile Virus, pollen counts, etc.
Local Climate Analysis Tool:Station Data For more information on Homogenization: http://journals.ametsoc.org/doi/pdf/10.1175/2008BAMS2613.1