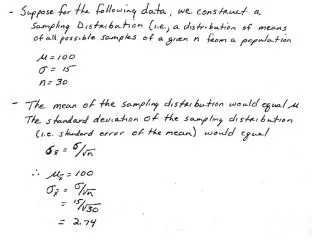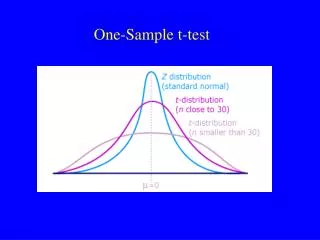
One-sample
One-sample. In the previous cases we had one sample and were comparing its mean to a hypothesized population mean However in many situations we will use the t-test to compare two samples/groups of data. Two samples. Previously compared sample mean to a known population mean

One-sample
E N D
Presentation Transcript
One-sample • In the previous cases we had one sample and were comparing its mean to a hypothesized population mean • However in many situations we will use the t-test to compare two samples/groups of data.
Two samples • Previously compared sample mean to a known population mean • Now we want to compare two samples • Null hypothesis: the mean of the population of scores from which one set of data is drawn is equal to the mean of the population of the second data set • H0: m1=m2 or m1 - m2 = 0
Independent samples • Consider the original case • Now want to consider not just 1 mean but the difference between 2 means • H0: m1 - m2 = 0
Which leads to... • Now statistic of interest is: • Mean of the sampling distribution is: • Sampling Distribution of the Difference Between Means
Variability • Standard error of the difference between means • Since two independent variables, variance of the difference between means equals sum of their variances (sqrt for standard error)
Note for the first timers: • Does not involve subtraction. The is simply a designation for the fact that we are dealing with the difference between two means (e.g. rather than standard error for one mean)
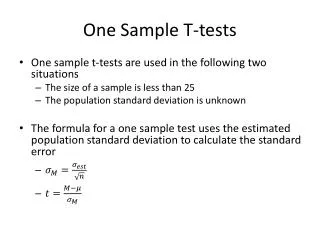
Same problem, same solution • Usually we do not know population variance (standard deviation) • Again use sample to estimate it • Result is distributed as t (rather than z)
Formula • All of which leads to:
But... • Recall before we stated that our null hypothesis is • In other words, we are testing the value for no difference (most of the time) • So, if the null hypothesis is true…
t test Original Simplified
Degrees of freedom • Across the 2 samples we have (n1-1) and (n2-1) df = (n1-1) + (n2-1) = n1 + n2 – 2
Steps for hypothesis test are still the same 1) State the research question 2) State the null hypothesis, which simply gives us a value to test, and alternative hypothesis 3) Construct a sampling distribution based on the null hypothesis and locate region of rejection (i.e. find the critical value on your table) How large a difference between means is required for statistical significance? 4) Calculate the test statistic (t) and see where it falls along the distribution in relation to the critical value (tcv) 5) Reach a decision and state your conclusion
Assumptions of a t-test • In order for the t-test to be a valid analysis, certain assumptions must be met (or close enough) or we will have to worry about generalizability (external validity) and consistency issues (internal validity)
Assumptions of a parametric* t-test • Dealing with normal populations • Variances of groups in question are equal (i.e. the standard deviations are not markedly different from one another) • Samples are randomly drawn from their respective populations and are independent of one another *A non-parametric t-test is ‘distribution-free’ and typically used for small sample sizes in which normality cannot be assumed. It is calculated differently.
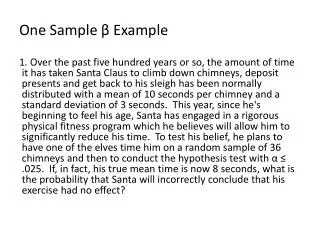
Example t-test • Compare two therapies for a particular affliction (e.g. depression) on a scale of 1-50 where 50 would be totally cured of all sadness forever after the therapy. • Mean Therapy 1 = 30 s = 5 N = 25 • Mean Therapy 2 = 26 s = 4 N = 25 • Ho: • H1: not Ho, or • Non-directional test (two-tailed)
Plug into formula • = 30 s = 5 N = 25 • = 26 s = 4 N = 25
Example Continued • t = 3.12 • Two-tailed test • Critical value: t.05(25 + 25 – 2) = t.05(48) = ~2.01 • Our t statistic is beyond the t critical value we’ve decided upon • Reject H0 There is a statistical difference between the means Treatment 1 is more effective. Dole out the happy pills!
Unequal sample sizes • Assumption: independent samples t test requires samples come from populations with equal variances • Two estimates of variance (one from each sample) • Generate an overall estimate that reflects the fact that bigger samples offer better estimates • If our two samples are quite different in size, the original formula for standard error will not be as good an estimate as it normally would be
Weighted average Calculate the pooled variance: Final result is:
Pooled variance estimate • Before we had • With unequal sample sizes we’ll use our pooled variance estimate • If sample sizes were equal we’d get the same result as our previous formula for std. error Note the sp2
Example New drug MemoPlus is supposed to aid memory. 5 people take the drug and we compare them to a control group of 10 people who take a placebo. Look at their free recall of 20 items on a list of related words. Drug: mean = 14, SD = 4.0 Control: mean = 10, SD = 6.0
Start by calculating the standard error Using Get: [note pooled variance nearer to group’s with larger n]
Calculate t • Enter the values: • Critical value for a two-tailed test • t.05(13) = 2.16
t = 1.33 tcv
Make a decision and draw your conclusion • Our t-statistic does not meet our criterion for rejection of the null hypothesis • MemoPlus isn’t effective