Matlab
Matlab. Ajánlott irodalom:. S. Gisbert : MATLAB, Typotex Kft, Budapest, 2005, ISBN 963 9548 49 9 ( Google Books ). Matlab. Command Window. Parancsok Több parancs -> .m file Sor végi ; jel Ha nincs kint, végrehajtja és az eredményt kiírja


Matlab
E N D
Presentation Transcript
Ajánlott irodalom: • S. Gisbert: MATLAB, Typotex Kft, Budapest, 2005, ISBN 963 9548 49 9 • (GoogleBooks)
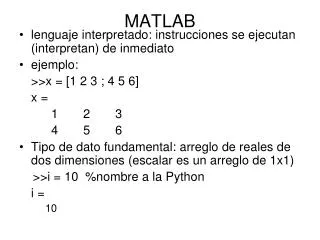
CommandWindow • Parancsok • Több parancs -> .m file • Sor végi ; jel • Ha nincs kint, végrehajtja és az eredményt kiírja • Ha kint van , az eredményt nem írja ki, de végrehajtja • Komment % • Indexelés 1-től • Helphelp
>> a=10 a = 10 >> A=1 A = 1 >> A+a ans = 11 >> a= [0,1,2] a = 0 1 2 >> a= [0,1,2]’ a = 0 1 2
>> M=[1,2,3;4,5,6;7,8,9] M = 1 2 3 4 5 6 7 8 9
>> a= [0:0.1:1]’ • a = • 0 • 0.1000 • 0.2000 • 0.3000 • 0.4000 • 0.5000 • 0.6000 • 0.7000 • 0.8000 • 0.9000 • 1.0000
>> ones(3) ans = 1 1 1 1 1 1 1 1 1 >> zeros(3) ans = 0 0 0 0 0 0 0 0 0
>> length(a) ans = 11 >> b=-1 b = -1 >> abs(b) ans = 1
>> a = rand(3) a = 0.9649 0.9572 0.1419 0.1576 0.4854 0.4218 0.9706 0.8003 0.9157 >> a=a*10 a = 9.6489 9.5717 1.4189 1.5761 4.8538 4.2176 9.7059 8.0028 9.1574
>> a = rand(3,1) a = 0.0357 0.8491 0.9340 >> a=a*10 a = 0.3571 8.4913 9.3399 >> min(a) ans = 0.3571 >> max(a) ans = 9.3399 >> size(a) ans = 3 3
x=[0:0.1:10]; y=sin(x); plot(x,y);
x=[0:0.1:10]; y=sin(x); plot(x,y); z=cos(x); plot3(x,y,z); grid
Plot tulajdonságok plot(x,y,'-'); plot(x,y,'.'); plot(x,y,'+'); plot(x,y,'*'); plot(x,y,'- '); plot(x,y,'--'); plot(x,y,'-+'); plot(x,y,'-*'); plot(x,y,'-o'); plot(x,y,'-s'); plot(x,y,'--o'); plot(x,y,'--s');
Plot tulajdonságok plot(x,y,'-+r'); plot(x,y,'-+g'); plot(x,y,'-+b'); plot(x,y,'-+k'); plot(x,y,'-+k', 'LineWidth',2); plot(x,y,'-ko', 'LineWidth',2,'MarkerEdgeColor','k', 'MarkerFaceColor','g','MarkerSize',10)
Plot tulajdonságok xlabel('X axis'); ylabel('Y axis'); ylim([-0.2 0.5]); xlim([2 3.5]);
Subplot subplot(2,1,1), plot(x, y); subplot(2,1,2), plot(y, x);
Hold x=[-pi:0.01:pi]; y1=sin(x); y2=cos(x); plot(x,y1,'-r') hold on plot(x,y2,'-b') grid
Hangok [x, fs] = wavread('win.wav'); sound(x, fs); plot(x);
Hangok fs = 44100; f0 = 200; % mintavételi frekvencia és alapfrekvencia T = 2; % időtartam n = [0:fs*T]; % időtengely (minta) x = sin(2*pi*f0*n/fs); % a jel plot(n/fs, x) sound(x, fs)
Képek img=rand(300); imshow(img)
Képek img=imread('img.jpg'); imshow(img) size(img) ans = 500 800 3
Képek img2=rgb2gray(img); imshow(img2)
Képek img2=rgb2hsv(img); imshow(img2)
Képek figure subplot(3,1,1) imshow(img2(:,:,1)) subplot(3,1,2) imshow(img2(:,:,2)) subplot(3,1,3) imshow(img2(:,:,3))