Download
1 / 35
350 likes | 469 Views
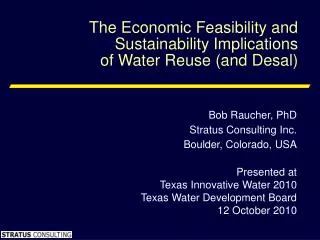
The Economic Feasibility and Sustainability Implications of Water Reuse (and Desal). Bob Raucher, PhD Stratus Consulting Inc. Boulder, Colorado, USA Presented at Texas Innovative Water 2010 Texas Water Development Board 12 October 2010. Background.

E N D
The Economic Feasibility and Sustainability Implicationsof Water Reuse (and Desal) Bob Raucher, PhD Stratus Consulting Inc. Boulder, Colorado, USA Presented atTexas Innovative Water 2010Texas Water Development Board12 October 2010
Background • “Economic Feasibility” => Net Economic Value • Going beyond financial viability (cash flow) • Focus on full range of benefits, compared to costs • “Sustainability” Implications • Triple Bottom Line perspective • Includes financial implications, but also social and environmental impacts • Case study illustration (Chino Basin, Southern CA)
Motivation • Reuse (& desal) are considered relatively expensive water supply options, raising the question: • Revenues rarely cover full cost of service (financial) • Is reuse worth the investment for a community? • A full perspective of the benefits and costs of reuse and desal is needed to answer that question … • Cost effectiveness relative to other water supply alternatives (good) • Factoring in the benefits of reuse or desal (better) • In the broader context of regional water resource management needs and objectives (best!)
Reuse or Desal from a Relative Cost of Water Supply Perspective
Reuse (and desal) from Benefit-Cost Perspective, as a Water Supply Option • The relative cost of reuse or desal is not the only relevant consideration • There are benefits that reuse and desal provide that most other alternatives may not • Need to identify and consider the full range of benefits (and costs), relative to other water supply alternatives
Counting All the Benefits(not necessarily to scale) $ Costs Benefits
Counting All the Benefits (cont.) $ Costs Benefits
Counting All the Benefits (cont.) $ Costs Benefits
Two Basic Approaches to Assess the Economics of Reliability 1. Portfolio Theory (drawn from financial sector) • Diversifying a portfolio • Used to scale the size of water supply options needed to meet a given reliability target 2. Stated Preference (scientifically designed surveys) • Aimed directly at the value people hold for reliability • Based on “Willingness To Pay” (WTP) • Already a body of US empirical research (but outdated) • We currently are are conducting new empirical work in US
Smarter Use of Water Desalination Water Reuse Catchment Management Groundwater Water Trading Surface Water Security through Diversity(copied from Ross Young, WSAA)
Value of Reliability Study: Example Water Supply Restriction Scenarios
Empirical Results to Date • Over 800 households surveyed so far:Denver and Austin (400+ in each) • 400 households to add in each: Southern CA (Long Beach), San Francisco, AZ (Phoenix?) • Willingness to Pay per household • $0 to $7 per year to avoid 1 year of low-level use restrictions • $20 to $34 per year to avoid 1 year of more severe water use restrictions • $130 - $136 per year to avoid all future water use restrictions over next 20 years
Opinions on Top Three Options for Supply Augmentation Options (Austin) Use local groundwater Mandate xeriscape for new homes Expand reservoirs
Opinions on Least Preferred Supply Augmentation Option (Austin) Add imported water Transfer water from agriculture Raise price
The Triple Bottom Line (TBL): Economics of Sustainability • TBL began as an enterprise-level reporting • Also useful for portraying the broad array of all benefits (and costs) of a project or program • Three bottom lines, to reflect: • Financial results (cash flow, revenues & costs) • Social outcomes (e.g., reliability, equity/fairness) • Environmental (e.g., instream flows, energy use) • In essence, TBL = a comprehensive benefit-cost analysis • Identifying and portraying all benefits & costs • Internal and external, market and nonmarket goods
TBL Graphic: Choosing the Least Cost Option May Not Deliver Social and Environmental Values to the Community
Options that Meet Broader Goals May Increase Financial Costs to a Utility, but Yield Larger Net Benefits to the Community
TBL Demonstrated the Benefit of Philadelphia’s Green Stormwater Control SOCIAL (>$2.3B) • Recreation ($525M) • Property values/aesthetics ($575 M) • Green Jobs ($125 M) • Public health: Heat stress ($1.1 B) • Energy cost savings ($36M) • Air Quality ($222 M) • Water quality ($147 M) • Carbon footprint ($27 M) • Ecosystems (+) • Cost of Green = cost of Grey CSO control = FINANCIAL ENVIRONMENTAL (> $400M)
TBL off a Non-Revenue Swap of Reclaimed Water to Retire Surface Rights SOCIAL (++) • Increase ag production • Preserve lands in ag uses • Support minority/ethnic farmers (currently lacking access to water) • Improve aesthetics (flows) in Sammamish River • Enhance summer instream flows for critical spawning and nursery habitat for endangered salmon population • Cost to provide Reclaim Water not recovered through revenues = FINANCIAL ENVIRONMENTAL (++)
Evaluating Reuse in Context of Integrated Water Resource Management • Adjudication of the Chino Basin • Local groundwater extractions not sustainable • Contamination (nitrates, salts, VOCs, etc.) • Impacted local groundwater users • Precluded reuse for irrigation or recharge (regulatory permits not approvable) • Impacted Santa Ana River, Orange County • Optimum Basin Management Program (OBMP) implemented as a broad water resource management strategy for the Chino Basin
The Comprehensive Nature of the OBMP • OBMP Includes a range of water supply elements • Desal, direct nonpotable reuse, indirect potable reuse (IPR), stormwater harvest, conservation • Aquifer storage and dry year yields (DYY) • Regional scope: large groundwater basin • Multiple jurisdictions included • Benefits (and some costs) extend beyond the Basin’s boundaries • Addresses a broad range of water quality and quantity concerns in (and beyond) the Chino Basin
TBL for Chino Basin Identified $2 Billion Savings and other Benefits SOCIAL ($??M) • Supply reliability (+) and local control (+) • Energy savings (5.8 billion kWh) • Import water availability for other MWD users (+) • Reduced volume but higher quality Santa Ana River flows to Orange County (+/-) • Carbon footprint ($22M) • Air quality ($84M) • Groundwater quality (+) • Surface water quality (+) • Cost saving to supply water in Chino Basin FINANCIAL ($1.9B) ENVIRONMENTAL (> $100M)
Chino Basin Water Supply Portfolio with OBMP Thousands of AF (2001-2030) 12,500 Imported MWD (1,550) Other local SW and GW (1,550) Imported MWD 10,000 (5,100) Chino Basin GW (4,570) ) 5,000 OBMP components Chino Basin GW (4,570) • Desal • Water reuse • Dry year yield • Enhanced GW Stormwater recharge • Conservation (4,750) Conservation With OBMP Preliminary estimates (October 2008)
Chino Basin Water Supply Portfolio with and without OBMP Preliminary estimates (October 2008)
OBMP Reducing Basin-wide Water Supply Costs by over 40% Thousands of AF PV Full Cost (2001-2030) (billions 2007$) $5.0B 12,500 Imported MWD (1,550) $4.0B Other local SW and GW (1,550) Imported MWD 10,000 (5,100) $2.7B $3.0B Chino Basin GW (4,570) $0.6B Other local SW and (outside grants $4.6B GW (1,550) and subsidies) (all borne locally) 5,000 $2.0B OBMP components Chino Basin GW (4,570) • Desal $2.1B • Water reuse (locally borne) • Dry year yield $1.0B • Enhanced GW Stormwater recharge • Conservation Non-potable reuse (4,750) Conservation With OBMP Without OBMP Preliminary estimates (October 2008)
OBMP Reducing Basin-wide Water Supply Costs by over 40% Thousands of AF PV Full Cost (2001-2030) (billions 2007$) $5.0B 12,500 Imported MWD (1,550) $4.0B Other local SW and GW (1,550) Imported MWD 10,000 (5,100) $2.7B $3.0B Chino Basin GW (4,570) $0.6B Other local SW and $4.6B (outside grants GW (1,550) and subsidies) (all borne locally) 5,000 $2.0B OBMP components Chino Basin GW (4,570) • Desal $2.1B • Water reuse (locally borne) • Dry year yield $1.0B • Enhanced GW Stormwater recharge • Conservation Non-potable reuse (4,750) Conservation With OBMP Without OBMP Preliminary estimates (October 2008)
Benefit-Cost Results: OBMP as a Whole • OBMP Costs • ~ $1.25 Billion in total (PV, 2000 - 2030) • OBMP Benefits (financial only): • ~ $1.9 Billion (PV water supply cost savings, ‘00 – ‘30) • Additional benefits both within and beyond the Basin • Net Benefits of OBMP: • Benefits > costs ~ $0.65 Billion (~53% rate of return) • Local net benefit ~ $1.2 Billion (~160% rate of return)
Reuse-Related Benefits and Costs (OBMP Context) • Cost of reuse • PV of ~$540 Million • ~43% of total OBMP costs • Benefit of reuse • Allocating 43% of OBMP benefits to reuse • ~$820 Million benefit (PV) • Net benefit: • >$280 Million ($820 - $540) • 53% rate of return ($280 / $540)
Conclusions • Based solely on cost ($/AF), reuse or desal may not appear to be cost-effective water supply choice • However, benefits associated with reuse or desal may well show the added expense is well warranted • When viewed within the TBL context of broader, integrated regional water resource management: • Obtain a much more meaningful sense of benefits • In Chino Basin, reuse and desal enable the realization of significant benefits • >$1.9 B over 30 yrs (53% Rate of Return)
Acknowledgements • WateReuse Research Foundation • California DWR • Water Research Foundation • Rich Atwater & Martha Davis (IEUA) • Howard Neukrug, Philadelphia Water Department
Thank you! Bob Raucher braucher@stratusconsulting.com + 1-303-381-8000 (ext 216) ------------------------ Stratus Consulting Inc. PO Box 4059(1881 Ninth Street, Suite 201)Boulder, CO 80306-4059USA