Download
1 / 16
160 likes | 276 Views
This document summarizes the THOR-CT3 project, focusing on sustained observations of ocean properties and fluxes critical to understanding the North Atlantic Thermohaline Circulation (THC). It outlines key tasks including monitoring Atlantic water inflow to Nordic Seas, dense water overflow across the Greenland-Scotland Ridge, and the export of deep waters from the Labrador Sea. Additionally, it reviews process studies, convection regions, freshwater transport, and the validation of climate models against THC observations, presenting final datasets and deliverables from 2011-2012.

E N D
THOR-CT3 Summary 26 September 2012 Bert Rudels Hendrik M. van Aken Kerstin Jochumsen Anna Friedrichs Nuno Nunes Detlef Quadfasel Katrin Latarius Bee Berx Jürgen Fischer Hedinn Valdimarsson BogiHansen Karin Margretha H. Larsen Stephen Dye Gerard McCarthy Steingrímur Jónsson Svein Østerhus Rolf Käse Stuart Cunningham
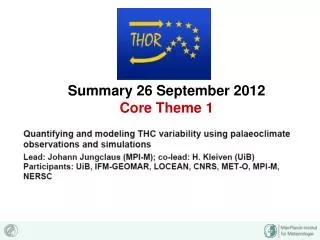
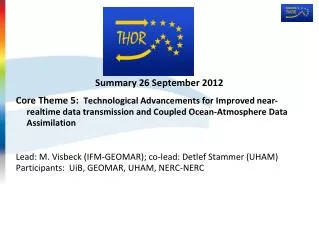
THOR Core Theme 3Observations of the North Atlantic THC • WP 3.1 Sustained observations of ocean properties and fluxes through key sections (Svein Østerhus) • Task 3.1.1 Monitoring the inflow of Atlantic water to the Nordic Seas • Task 3.1.2 Monitoring the dense water overflow across the GSR • Task 3.1.3 Monitoring the export of deep waters at the exit of the Labrador Sea • Task 3.1.4 Validating variability of climate models against MOC/THC observations • WP 3.2 Monitoring watermass formation in convection regions south of the ridge (Jürgen Fischer) • Task 3.2.1 Monitoring convection in the central Labrador Sea • Task 3.2.2 Monitoring convection in the central Irminger Sea • WP 3.3 Process studies (Bert Rudels) • Task 3.3.1 Entrainment of ambient waters into the overflows • Task 3.3.2 Fresh water transport north of Iceland
Deliverables from CT3 2011/2012 ------------------------------------------------------------------------------- D24: 30 Nov. 2011 Strategy for monitoring fluxes across the shallow parts of the Greenland-Scotland Ridge. (UIB) DONE D25: 30 Nov. 2011 Reference data set on long-term variability AR7E section. (NIOZ) DONE D26: 30 Nov. 2011 Data set and entrainment estimates from DS experiments. (FMI) DONE ------------------------------------------------------------------------------- D36 Final data set for fluxesacrosskeysections, from observational and modellingapproaches. 3.1 5 UIB D37 Final data sets for convection sites and AR7E overturning 3.2 8 GEOMAR D38 Time series data offreshwater transport in the EIC. 3.3 12 FMI
THOR Deliverables with contributions from CT3 • D28 (WP4.2) Assessment of the impact of ocean observations on the predictability of the THC • D34 (WP2.1) Updated evaluation of ocean state estimates, taking account of new observations during the project (historical surface salinity plus new observations from CT3 and outside) • D41(WP4.2) Report on ocean observing systems needed for decadal predictions of the THC • D42 (WP5.1) Report on the use of near real time data transmission systems and their potential to increase the accuracy of Atlantic Thermohaline Circulation assessments and predictions • D44(WP6.1 and all) Overall assessment of priorities for observing system, data assimilation and model develop for a quasi-operational THC decadal forecast system • D45(WP6.1) Final Scientific Report to Commission
Deliverables from CT3 November 2012 D36 Nov 2012 Final data set for fluxes across key sections, from observational and modelling approaches. (UIB) D37 Nov 2012 Final data sets for convection sites and AR7E overturning (GEOMAR) D38 Nov 2012 Time series data of freshwater transport in the EIC. (FMI)
D36: Final data set for fluxes across key sections, from observational and modelling approaches. (UIB)
AGU, 2003 Transport (mass and heat) observatories NACLIM MAIA
Atlantic inflow temperature 1950 – 2010 Shetland branch Faroe branch Iceland branch
D37: Final data sets for convection sites and AR7E overturning (GEOMAR) Topography of the Irminger Sea between Greenland and the Reykjanes Ridge. The hydrographic stations of the AR7E section as it was surveyed in 2011 are shown as white dots. In the Irminger Sea, west of the Reykjanes Ridge, these are typical for all surveys of the WOCE AR7E line since 1990. The mooring locations LOCO2 and LOCO3 where the near bottom temperature and salinity were measured continuously are indicated as stars. The white bar shows the approximate location of the Angmagssalik current meter array, mentioned several times in the text. The grey squares show the locations where since 1991 the lowest near bottom potential temperature was encountered per survey. HendrikM. van Aken, , M. Femke de Jong1NIOZ Royal Netherlands Institute for Sea Research, Den Burg, Texel, Netherlands http://dx.doi.org/10.1016/j.dsr.2012.04.004,
D38: Time series data of freshwater transport in the EIC. (FMI)
Final reports The EC requires from the project two "final reports": one is a scientific report, the other is mostly an impact/dissemination report. • The scientific final report: this will consist of a book with a 30 pages summary of the major THOR project results divided by core theme. This was decided at the Bergen meeting in Nov. 2011. This means that each core theme should produce a minimumof 6 pages in A4 listing the results achieved. • The second report needs also your input on the following: • The potential impacts (including the socio-economic impact and the wider societal implications of the project so far) of the results achieved in the Core Themes. ** • the main dissemination activities implemented in the past 4 years and • indication of the exploitation of results **
THOR objectives for Core Theme 3 • THOR will develop and operate an optimal ocean observing system for the North Atlantic component of the THC. This observation system, consisting of arrays of self contained instruments as well as ship- and space-borne measurements, will provide accurate time series of mass, heat and salt fluxes at key locations, allowing for the first time to assess the strength of the Atlantic THC. Quantification of the THC related mass, heat and salt fluxes in the subpolar and in the subtropical Atlantic on seasonal to decadal time scales: An observing system for measuring the fluxes will be established, consisting of self contained moorings, ship- and space borne measurements and autonomous instrumentation. These time series will be supplemented and extended in time with flux estimates from models with data assimilation. Recommendations for observational and modelling systems: Based on observation and model analysis specific recommendations will be made for the development of sustained observational and modelling systems, to improve the skill of decadal THC forecasts
THOR is a project financed by the European Commission through the 7th Framework Programme for Research, Theme 6 Environment, Grant agreement 212643 http://ec.europa.eu/index_en.htm