Download
1 / 50
520 likes | 983 Views
Satellite Data and Water Resources Management. Yellow River Project “973-G19990436”. Prof. Liu Changming & S. Yang. Chinese Academy of Sciences, Beijing Normal University. Features of Water Resources in China. 1.Although water is abundance, water for each person is short.

E N D
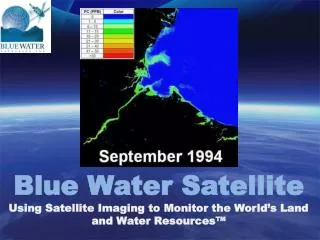
Satellite Data and Water Resources Management Yellow River Project “973-G19990436” Prof. Liu Changming & S. Yang Chinese Academy of Sciences, Beijing Normal University
Features of Water Resources in China 1.Although water is abundance, water for each person is short. 2. Water resource distribution differs from space to space 3. Temporal distribution is also uneven 4. Water pollution is serious
Freshwater resources in China:Average annual amount totals 28124 108 m3 Surface (R): 27115 108 m3Ground (G): 8288 108 m3Interacted (RG): 7279 108 m3
The Condition of Water Resources Management in China 1. Having the system of water resources management 2. Having a series of rules for water resources management 3. Having many institutes and universities to research water resources management
Main problems of water resources research in China 1. Exactly and quickly forecasting flood 2. Analyzing Yellow River lost flow 3. Solving drought in North China 4. Controlling water pollution in South China 5. Preventing water and soil loss in China
Problems in Research for Hydrologists and Water Resources Managers Difficulty in holding enough data about hydrological processes with precisely spatial and temporal resolution
Advantages of RS Data in WRM • Able to collect land surface data in a wide space • Afford dynamic data of hydrological research • Low-Cost in comparison with measurements • Good for monitoring
SPOT 4 - March 24, 1998 SPOT 3 - Sept. 25, 1993 SPOT 2 - Jan. 22, 1990 SPOT 1 - Feb. 21, 1986 Availability of RS Data Landsat Radasat AQUA
Landsat Landsat 1 (07/12/1972 - 01/06/1978) - RBV, MSS (80m) Landsat 2 (01/22/1975-07/27/1983) -RBV, MSS (80m) Landsat 3 (03/05/1978-09/07/1983) -RBV, MSS (80m) Landsat 4 (07/16/1982 - ) - MSS, TM (30m, 120m) Landsat 5 (03/01/1984 - ) - MSS, TM (30m, 120m) Landsat 6 (10/05/1993): ETM Landsat 7 (04/23/1999 - ) - ETM+ (15m,30m, 60m)
Radarsatlaunched in November 1995 RADARSAT is an advanced Earth observation satellite system developed by Canada to monitor environmental change and to support resource sustainability.It carried a Synthetic Aperture Radar (SAR), a powerful microwave instrument that can transmit and receive signals to "see" through clouds and darkness, obtaining detailed images of the Earth.
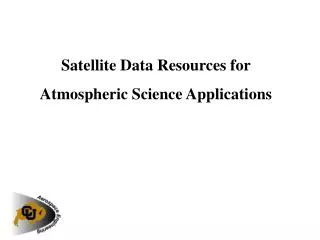
TERRA (EOS AM) - 1999/12/18 Launched TERRA sensors : ASTER: Advanced Spaceborne Thermal Emission and Reflection Radiometer (15m - 3 bands in VNIR; 30m - 6 bands in SWIR; 90m - 5 bands in TIR) MODIS: Moderate Resolution Spectroradiometer (0.4 - 14.4 mm) (250m - 2 bands, 500m - 5 bands, 1000m - 29 bands) CERES: Clouds and the Earth's Radiant Energy System MISR: Multi-angle Imaging Spectroradiometer MOPITT: Measurements of Pollution in the Troposphere.
AQUALaunched on May 4 2002 READY TO STUDY EARTH'S WATER CYCLE
SPOT 4 - March 24, 1998 SPOT 3 - Sept. 25, 1993 SPOT 2 - Jan. 22, 1990 SPOT 1 - Feb. 21, 1986 SPOT SPOT-4 VEGETATION
Launched on Sep 4 1999 Properties: 1m (0.45-0.90 mm), 4m : (Band 1: 0.45-0.52 mm Blue) (Band 2: 0.52-0.60 mm Green) (Band 3: 0.63-0.69 mm Red) (Band 4: 0.76-0.90 mm NIR)
QuickbirdLaunched on18 October 2001 The imaging sensors are panchromatic and multispectral. Properties of Sensor: 0.61m: 450nm-900nm 2.44m: 450nm-520nm 520nm-600nm 630nm-690nm 760nm-900nm
Application to Evaluation of Eco-environment Water Transfer Project of Western Route Headwaters
Use remote sensing to interpret the messages of land cover and vegetation cover in the project area, and use GIS to get topography,NPP,annual rainfall and mean temperature. On the basis of setting up synthetically natural environment index, the West Route Project Area in upstream Yellow River is separated four grades regions, and they are synthetically analyzed on the aspect of natural environment.
林地 3384-4061 4737-6091 2031-2707 草地 荒草地 高山寒漠 2707-3384 4061-4737 灌丛地 沼泽地 裸地 裸地 单位:m 0 50km 0 50km 0 740gC/m2yr 0 50km B A 720mm 0 50km 480 高覆盖度 中覆盖度 中高覆盖度 低覆盖度 -8 20.4℃ C D 0 50km 0 50km F E A 工程区地势图 B 工程区土地覆盖类型图 C 工程区陆地植被净初级生产力图 D工程区年降水量图 E工程区年均温度图 E工程区植被覆盖度图
Pixel Number Pixel Number 象元数(个) 象元数(个) NPP(gC/m2yr) 海拔高度(m) Altitude (m) NPP(gC/m2yr) Pixel Number Pixel Number 象元数(个) 象元数(个) 年降水量(mm) (mm) 年均温度(℃) Rain (mm) Temperature (℃) 图8 一级区中海拔高度、NPP、年降水量和年均温度统计图 Fig.8 The statistic of altitude, NPP, rain and temperature in the first grade 图 一级区中海拔高度、NPP、年降水量和年均温度统计图 Fig. The statistic of altitude, NPP, rain and temperature in the first grade
Pixel Number Pixel Number 象元数(个) 象元数(个) NPP(gC/m2yr) 海拔高度(m) NPP(gC/m2yr) Altitude (m) Pixel Number 象元数(个) 象元数(个) Pixel Number 年均温度(℃) 年降水量(mm) Temperature (℃) Rain (mm) 图, 二级区中海拔高度、NPP、年降水量和年均温度统计图 Fig.9 The statistic of altitude, NPP, rain and temperature in the second grade
象元数(个) 象元数(个) Pixel Number Pixel Number NPP(gC/m2yr) 海拔高度(m) Altitude (m) NPP(gC/m2yr) Pixel Number 象元数(个) Pixel Number 象元数(个) 年均温度(℃) 年降水量(mm) Rain(mm) Temperature(℃) 三级区中海拔高度、NPP、年降水量和年均温度统计图 Fig. The statistic of altitude, NPP, rain and temperature in the third grade
Pixel Number 象元数(个) Pixel Number 象元数(个) NPP(gC/m2yr) 海拔高度(m) Altitude (m) NPP(gC/m2yr) Pixel Number Pixel Number 象元数(个) 象元数(个) 年均温度(℃) 年降水量(mm) Rain (mm) Temperature (℃) 四级区中海拔高度、NPP、年降水量和年均温度统计图 Fig. The statistic of altitude, NPP, rain and temperature in the fourth grade
欧洲气象卫星 日本卫星 风云2号 GTS降雨量站数据 流域水循环 降雨量处理 云的分层和频率 每小时可见光数据 降雨量图 绘制云覆盖图 大气温度和能量平衡过程 全球净辐射 每小时的 红外数据 实际蒸散 表面温度和反射率 大气校正 Processing
Case Study 黄河流域水资源演化规律与可再生维持机理研究(G19990436)
Evapotranspiration Estimation Based on AVHRR/NOAA Data- Case Study on the Yellow River Basin
Data of weather PenmanModel Possible E Water balance Precipitation Precipitation NDVI Actual E Moisture Index Temperature Remote Sensing model Evapotranspiration Estimation Model Designing Process
Relationship of ET to Accumulated NDVI and RMI (Relative Moisture Index) 463 463 * * RMI RMI = = + + ET ET 150 150 + + - - S S - - 1 1 exp( exp( 1 1 . . 79 79 * * ( ( NDVI NDVI 1 1 . . 34 34 )) )) = = RMI RMI MI MI M M I I P P = = MI MI S S 0 0 . . 10 10 T T > > 0 0 P:Annual Precipitation :Accumulative Temperature higher than 0ºC Actual Evapotranspiration v.s. Calculated one based on RS Data
Integrative Model of AVHRR and Weather Data : Soil moisture VTCI: Vegetation temperature condition index MI: weather moisture index
热红外反演地面组分温度、近地面气温等等困难热红外反演地面组分温度、近地面气温等等困难 Soil Moisture Study by MODIS 研究黄河流域土壤水分 Methodology 研究方法 Relationship between Soil Moisture and Crop Water Shortage Index (CWSI) 通过SPAC理论,确立作物缺水指数(CWSI)和土壤水分间的模型: 微气象学建立CWSI的模型 温度梯度方法确立CWSI 研究方法是:通过植被冠层近红外波段对土壤水分的敏感性,达到反演干旱、半干旱区植被覆盖条件下土壤水分的目的
应用MODIS数据研究黄河流域土壤水分 Spectral Characters of Canopy植被冠层波谱特征 Retrieving CWSI from Moisture Absorption Depression Valley of Leaves
Data Processing 工作程序 Atmosphere Adjustment 大气水汽吸收校正 Modtran Water Absorbing Depth Index 建立植被水分吸收指数(WADI) MODIS第5、6和26波段 Filtering Soil Effects 过滤土壤背景影响 MODIS第1、2波段 Relation between Soil Moisture and WADI 土壤水分与WADI相关性分析 0-20cm土壤容积含水量
The Remote sensing Model for soil moisture The relation between WADI and Soil moisture Soil Moisture(%) a=35 b=-7109 t=0.15 R=0.82 WADI: Water Absorbing Depth Index The reflectance of band 5 6 26 in MODIS WADI The middle wave length of band 5 6 26 in MODIS
The image of soil moisture calculated by RSMSM Y: Soil Moisture X: WADI a, b, t: parameters
卢氏以上流域 Digital Elevation Model 地形空间变化:600m~2612m Grid: 100 m x 100 m Rows:707 Cols:1339
Needs for RS Data Application in WRM • Best Spatial Resolution application • Best Temporal Resolution • Adequate Spectral Band and Resolution
• Satellite data supplies plenty of information for Water resources Management(WRM)• It is a useful method for WRM to integrate Remote Sensing and Water cyclic theories• WRM will focus on high spatial and high spectral resolution data in future