Download
1 / 39
390 likes | 512 Views
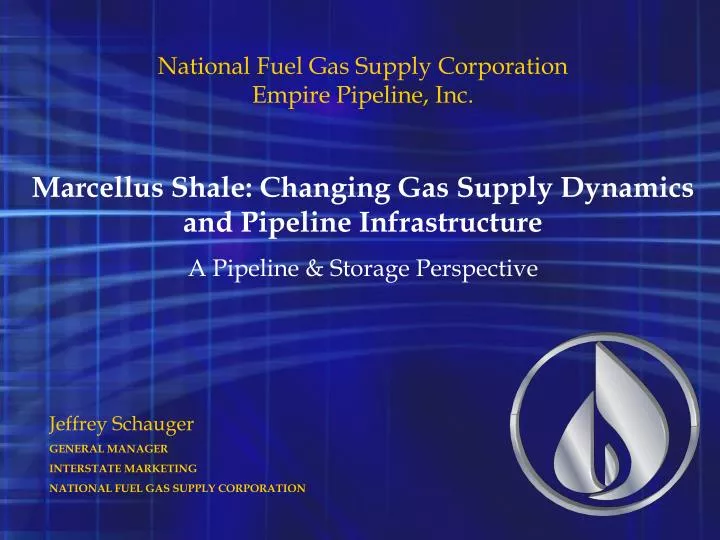
National Fuel Gas Supply Corporation Empire Pipeline, Inc. Marcellus Shale: Changing Gas Supply Dynamics and Pipeline Infrastructure A Pipeline & Storage Perspective. Jeffrey Schauger GENERAL MANAGER INTERSTATE MARKETING

E N D
National Fuel Gas Supply Corporation Empire Pipeline, Inc. Marcellus Shale: Changing Gas Supply Dynamics and Pipeline Infrastructure A Pipeline & Storage Perspective Jeffrey Schauger GENERAL MANAGER INTERSTATE MARKETING NATIONAL FUEL GAS SUPPLY CORPORATION
Safe Harbor for Forward Looking Statements This presentation may contain “forward-looking statements” as defined by the Private Securities Litigation Reform Act of 1995, including statements regarding future prospects, plans, performance and capital structure, anticipated capital expenditures and completion of construction projects, as well as statements that are identified by the use of the words “anticipates,” “estimates,” “expects,” “forecasts,” “intends,” “plans,” “predicts,” “projects,” “believes,” “seeks,” “will,” “may,” and similar expressions. Forward-looking statements involve risks and uncertainties, which could cause actual results or outcomes to differ materially from those expressed in the forward-looking statements. The Company’s expectations, beliefs and projections contained herein are expressed in good faith and are believed to have a reasonable basis, but there can be no assurance that such expectations, beliefs or projections will result or be achieved or accomplished. In addition to other factors, the following are important factors that could cause actual results to differ materially from results referred to in the forward-looking statements: changes in economic conditions, including economic disruptions caused by terrorist activities, acts of war or major accidents, and downturns in economic activity including national or regional recessions; changes in demographic patterns and weather conditions, including the occurrence of severe weather such as hurricanes; changes in the availability and/or price of natural gas or oil and the effect of such changes on the accounting treatment of derivative financial instruments or the valuation of the Company’s natural gas and oil reserves; uncertainty of oil and gas reserve estimates; ability to successfully identify, drill for and produce economically viable natural gas and oil reserves, including shortages, delays or unavailability of equipment and services required in drilling operations; significant changes from expectations in the Company’s actual production levels for natural gas or oil; changes in the availability and/or price of derivative financial instruments; changes in the price differentials between various types of oil; inability to obtain new customers or retain existing ones; significant changes in competitive factors affecting the Company; changes in laws and regulations to which the Company is subject, including changes in tax, environmental, safety and employment laws and regulations; governmental/regulatory actions, initiatives and proceedings, including those involving acquisitions, financings, rate cases (which address, among other things, allowed rates of return, rate design and retained gas), affiliate relationships, industry structure, franchise renewal, and environmental/safety requirements; unanticipated impacts of restructuring initiatives in the natural gas and electric industries; significant changes from expectations in actual capital expenditures and operating expenses and unanticipated project delays or changes in project costs or plans; the nature and projected profitability of pending and potential projects and other investments, and the ability to obtain necessary governmental approvals and permits; occurrences affecting the Company’s ability to obtain funds from operations, from borrowings under our credit lines or other credit facilities or from issuances of other short-term notes or debt or equity securities to finance needed capital expenditures and other investments, including any downgrades in the Company’s credit ratings; ability to successfully identify and finance acquisitions or other investments and ability to operate and integrate existing and any subsequently acquired business or properties; impairments under the SEC’s full cost ceiling test for natural gas and oil reserves; changes in the market price of timber and the impact such changes might have on the types and quantity of timber harvested by the Company; significant changes in tax rates or policies or in rates of inflation or interest; significant changes in the Company’s relationship with its employees or contractors and the potential adverse effects if labor disputes, grievances or shortages were to occur; changes in accounting principles or the application of such principles to the Company; the cost and effects of legal and administrative claims against the Company or activist shareholder campaigns to effect changes at the Company; changes in actuarial assumptions and the return on assets with respect to the Company’s retirement plan and post-retirement benefit plans; increasing health care costs and the resulting effect on health insurance premiums and on the obligation to provide post-retirement benefits; or increasing costs of insurance, changes in coverage and the ability to obtain insurance. For a discussion of these risks and other factors that could cause actual results to differ materially from results referred to in the forward-looking statements, see “Risk Factors” in the Company’s Form 10-K for the fiscal year ended September 30, 2009 and and the Company’s Form 10-Q for the quarter ended December 31, 2009. The Company disclaims any obligation to update any forward-looking statements to reflect events or circumstances after the date hereof or to reflect the occurrence of unanticipated events.
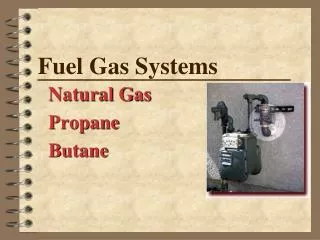
National Fuel Gas CompanyPrincipal Businesses National Fuel Gas Company P&S Midstream Energy Mktg Utility Timber E&P National Fuel Gas Supply Corporation & Empire Pipeline Highland Forest Resources, Inc. and NE Division of Seneca Resources Corp. National Fuel Gas Midstream Corporation Seneca Resources Corporation National Fuel Gas Distribution Corporation National Fuel Resources, Inc.
PL&S: ~3,000 Miles of Pipeline, 60,000+ hp LDC: ~725,000 Customers Served throughout Western NY and Northwestern PA Own/Operate 27 Fields; Co-Own/Operate 4 Fields Storage Capacity ~70 bcf
Lake Ontario Lake Ontario Lake Ontario Niagara Empire Pipeline TCPL Interconnects: Niagara, Chippawa Chippawa CANADA Empire Connector CANADA Corning Interconnects: Empire, Millennium Lake Lake Lake Corning Erie Erie Erie Independence 5 Line - A Millennium National Fuel’s Pipeline & Storage System NY NY Tuscarora Storage PA PA Ellisburg Ellisburg Interconnects: TGP, DTI Leidy Leidy Interconnects: Transco, TETCO, DTI National Fuel Gas Company NFGSC System Storages Bristoria Interconnect: TETCO – M2 NFGSC System Pipelines Empire State Pipeline PA OH PA OH Interconnects
FACT: North American Shale has dramatically altered the domestic gas Supply picture.
FACT: North American Shale has dramatically altered the domestic gas Supply picture. Relatively low Unconventional costs vs Conventional The Key- Technological advances Shale production has grown from 3% of the U.S. Gas Supply in 2005 to 20% in early 2010 In 2009 US Local Natural gas production highest since 1973. PA production has doubled since the pre-shale days
Marcellus - “The Beast in the East” Recoverable area > 95,000 sq mi Depth 5,000 ft +, Thickness 50 ft – 250 ft Potentially the largest field in the U.S. - recoverable reserves estimated in the 100’s of TCFs Low breakeven costs – maybe lowest of major U.S. shale plays Marcellus Shale play is vast – and it’s still early
Marcellus Shale Production Forecast(Based on Conservative 50 Tcf Recoverable Reserve Estimate) 7,000 3,000 6,000 2,500 5,000 2,000 4,000 # Wells First Delivered MMcf/d 1,500 3,000 1,000 2,000 500 1,000 0 0 2009 2012 2015 2018 2021 2024 2027 2030 2033 2036 2039 2042 2045 Production Forecast Wells First Delivered Source: Black & Veatch Analysis
Other Telling Indicators…. • What large players are saying: • “…We continue to ramp up our activities in the Marcellus…” • “…accelerate sharply our development of the Marcellus.. “ • “…able to utilize new drilling techniques that allows (us) to affordably reach gas supplies in the Marcellus…that previously had been too expensive to tap.’ • Producers taking on firm capacity positions to ensure production flows: Range, EQT, Chesapeake, Statoil, Cabot, East Resources, Fortuna • Majors and investors jumping into the Marcellus fray • Pittsburgh area exploding – tightening labor market • TGP 300 Line
Eastern Mainline Export Points and Other Major Pipelines EAST HEREFORD NAPIERVILLE PHILLISBURG IROQUOIS DRACUT NIAGARA CHIPPAWA DOVER BROOKFIELD DAWN ELLISBURG RAMAPO ST. CLAIR LEIDY
Pre-Marcellus Gas Supply Sources to the Northeast ONTARIO Traditionally gas supply sources have come from Canada, the Rockies, and the Gulf Coast Region. NIAGARA New York LEIDY Pennsylvania
Post Marcellus Gas Supply Sources in North America Displacement Displacement Displacement Rockies Appalachia Displacement Displacement Displacement Midcontinent Southeast/ Gulf
Post-Marcellus Gas Supply Sources to the Northeast ONTARIO Marcellus Shale has resulted in the traditional gas supply being displaced. NIAGARA New York LEIDY Pennsylvania
NFGSC System Increased Producer Activity 55% increase in IC requests from 2009-2010
NFGSC System Volumes Associated with IC Requests
Canadian Imports Source: EIA
Effects of Shales on LNG Imports Source: Bentek/EIA
Observations… “Pipeline Geology” Displacement Significant gas supply being added to large long-haul pipes: TGP, TETCO, TCO, DTI, NFG Shift in flows due not only to Marcellus but effects of REX, LNG, and other shale plays The Interstate Pipeline System Downstream of Storage (Ellisburg/Leidy and Oakford) is at Capacity Key Market Segment: Power Gen Markets in NYC, Mid-Atlantic, and Ontario. Rate of growth? Overall market will grow – rate depends on economy, but unlikely to match increase in gas supply in market area.
…And Effects of Marcellus in the Northeast • Pricing Dynamics • New West to East pipeline infrastructure will increase the Western Basis and put downward pressure on Eastern Market Prices • Overall flattening of basis and decreased price volatility. • Flows • Displacement of traditional gas supply, and reverse flow south to north • Focus on Unconventional plays • Reduced reliance on LNG • Shifting plans related to Alaskan gas supply • Infrastructure • NE Markets have competitive advantage as transportation and fuel costs decrease from transporting gas a shorter distance • Long haul pipelines will likely see lower utilization and decreased revenue on pipelines from the Gulf to the Northeast
Effects of Marcellus Shale in the Northeast Changing the Pipeline Infrastructure in the Northeast • 34 Potential New Projects Planned through 2014 • Total Increased Potential Capacity of 13,693 MMcf/d Source: Bentek
2010 Pipeline Expansion Projects Map Source: Bentek
National Fuel GasPL&S Infrastructure Expansion Plans • Y-M53 to Leidy • Lamont Compressor Station • Line N Expansion • Northern Access Expansion • Tioga County Extension
PIPELINE & STORAGE EXPANSION INITIATIVES Y-M53 DIRECT INTERCONNECTS 31
PIPELINE & STORAGE EXPANSION INITIATIVES LAMONT COMPRESSOR STATION PHASE 1 & 2 LAMONT COMPRESSOR STATION PHASE I & II 32
PIPELINE & STORAGE EXPANSION INITIATIVES LINE “N” EXPANSION PHASE I & II 33
NATIONAL FUEL PIPELINE & STORAGE EXPANSION INITIATIVES NORTHERN ACCESS EXPANSION 34
PIPELINE & STORAGE EXPANSION INITIATIVES TIOGA COUNTY EXTENSION PHASE I & II 35
PIPELINE & STORAGE EXPANSION INITIATIVES LAMONT COMPRESSOR STATION PHASE I & II NORTHERN ACCESS EXPANSION TIOGA COUNTY EXTENSION PHASE I & II Y-M53 DIRECT INTERCONNECTS WEST TO EAST LINE “N” EXPANSION PHASE I & II APPALACHIAN LATERAL 36
Infrastructure and Transporter-related Challenges • GQ • Creditworthiness • Timelines • Shifting Pipeline Grid Dynamics & Valuation • Producer risk tolerances • IC requests
On the Horizon…. New supply areas will continue crowd out traditional ones “Non-firm” production eventually at risk All bets off with regard to traditional flows, basis, and commodity pricing - price and gas supply-driven changes Certain oversupplied producing areas/pipes could see price bloodletting Canadian markets will soon gain access to Marcellus supply Large need for midstream/gathering infrastructure Utilities: encouraged by proliferation of Marcellus gas supply but will adjust portfolios with caution
Thank You Please visit us at www.nationalfuelgas.com