Download
1 / 52
520 likes | 534 Views
Learn about air pressure and its relationship with temperature, density, and altitude. Explore concepts like Boyle's Law and Charles's Law, and understand how pressure variations on isobaric maps influence weather patterns.

E N D
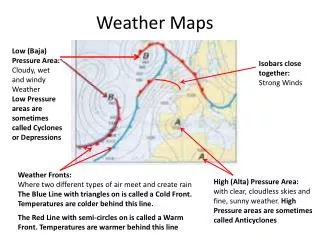
What is Air Pressure? Pressure = Force/Area What is a Force? It’s like a push/shove In an air filled container, pressure is due to molecules pushing the sides outward by recoiling off them Recoil Force
Recoil Force Air Pressure Concept applies to an “air parcel” surrounded by more air parcels, but molecules create pressure through rebounding off air molecules in other neighboring parcels
Recoil Force Air Pressure At any point, pressure is the same in all directions But pressure can vary from one point to another point
Higher density at the same temperature creates higher pressureby more collisions among molecules of average same speed Higher temperatures at the same density creates higher pressureby collisions amongst faster moving molecules
Ideal Gas Law • Relation between pressure, temperature and density isquantifiedby theIdeal Gas Law P(mb) = constant x d(kg/m3) x T(K) • Where Pispressurein millibars • Whered isdensityin kilograms/(meter)3 • WhereT is temperaturein Kelvin
Ideal Gas Law • Ideal Gas Law is complex P(mb) = constant x d(kg/m3) x T(K) P(mb) = 2.87 x d(kg/m3) x T(K) • If you change one variable, the other two will change. It is easiest to understand the concept if one variable is held constant while varying the other two
Ideal Gas Law P = constant x d x T (constant) With T constant, Ideal Gas Law reduces to Law reduces to • P varies with d Boyle's Law Denser air has a higher pressure than less dense air at the same temperature
Ideal Gas Law P = constant x d (constant) x T With d constant, Ideal Gas Lawreduces to • P varies with T Charles's Law Warmer air has a higher pressure than colder air at the same density
Ideal Gas Law P (constant) = constant x d x T With P constant, Ideal Gas Law reduces to T varies with 1/d Colder air is more dense (d big, 1/d small) than warmer air at the same pressure
Summary • Ideal Gas Law Relates Temperature-Density-Pressure
Pressure-Temperature-Density Pressure Decreases with height at same rate in air of same temperature Constant Pressure (Isobaric) Surfaces Slopes are horizontal 300 mb 400 mb 500 mb 9.0 km 9.0 km 600 mb 700 mb 800 mb 900 mb 1000 mb Minneapolis Houston
Pressure-Temperature-Density WARM Pressure (vertical scale highly distorted) Decreases more rapidly with height in cold air than in warm air Isobaric surfaces will slope downward toward cold air Slope increases with increasing height Animation 300 mb COLD 400 mb 500 mb 9.5 km 600 mb 8.5 km 700 mb 800 mb 900 mb 1000 mb Minneapolis Houston
Summary • Ideal Gas Law Implies Pressure decreases more rapidly with height in cold air than in warm air. • Consequently….. Horizontal temperature differences lead to sloping constant pressure surfaces, or horizontal pressure differences! (And horizontal pressure differences lead to air motion…or the wind!)
Isobaric Maps • Weather maps at upper levels are analyzed on isobaric (constant pressure) surfaces. (Isobaric surfaces are used for mathematical reasons that are too advanced to include in this course!) • Isobaric maps provide the same information as constant height maps, such as: Low heights on isobaric surfaces correspond to low pressures on constant height surfaces! Cold temps on isobaric surfaces correspond to cold temperatures on constant height surfaces!
(Constant height) Downhill 496 mb PGF 504 mb Ahrens, Fig. 2, p141 Isobaric Maps Some generalities: 1) High/Low heights on an isobar surface correspond to High/Low pressures on a constant height surface 2) Warm/Cold temps on an isobaric surface correspond to Warm/Cold temps on a constant height surface 3) The PGF on an isobaric surface corresponds to the downhill direction
Contour MapsHow we display atmospheric fields Portray undulations of 3D surface on 2D map A familiar example is aUSGS Topographic Map It’s a useful way to display atmospheric quantities such astemperatures, dew points, pressures, wind speeds, etc. Gedlezman, p15
Contour Maps “To successfully isopleth the 50-degree isotherm, imagine that you're a competitor in a roller-blading contest and that you're wearing number "50". You can win the contest only if you roller-blade through gates marked by a flag numbered slightly less than than 50 and a flag numbered slightly greater than 50.” https://courseware.e-education.psu.edu/public/meteo/meteo101demo/Examples/Section2p02.html Click “interactive exercise” https://courseware.e-education.psu.edu/public/meteo/meteo101demo/Examples/Section2p03.html Click first “here” https://courseware.e-education.psu.edu/public/meteo/meteo101demo/Examples/Section2p04.html Click “interactive isotherm map” From
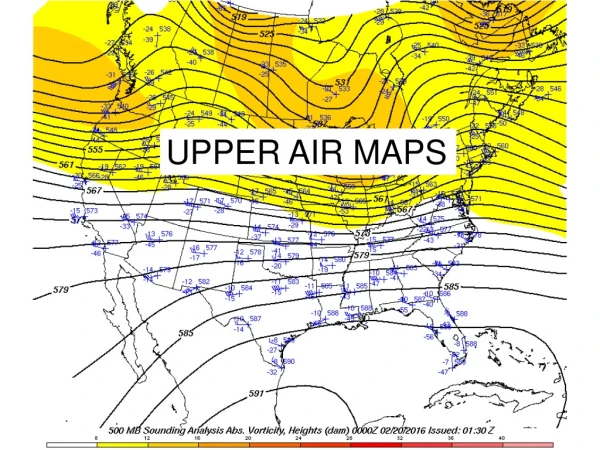
Upper-Air Model Responsible for boxed parameters Conditions at specific pressure level • Wind • Temperature (C) • Moisture (Later) • Height above MSL • UA 500mb Analysis Ahrens, p 431 Ahrens, p 427
Region of Low Heights TROUGH and Cold Region of High Heights RIDGE and Warmth Height contours Temps shaded
PGF Wind
Today’s Question…. Do Rocks Always Roll Downhill? PGF Upper-Level Winds Gedzelman, p 247
Take Home Points • Station Pressure and Surface Analyses (later) Reduced to Mean Sea Level Pressure (SLP) PGF Corresponds to Pressure Differences • Upper-Air Maps On Isobaric (Constant Pressure) Surfaces PGF Corresponds to Height Sloping Downhill • Contour Analysis Surface Maps-Analyze Isobars of SLP (later) Upper Air Maps-Analyze Height Contours
Take Home Points • Wind Direction and PGF Winds more than 1 to 2 km above the ground are perpendicular to PGF! Analogous a marble rolling not downhill, but at a constant elevation with lower altitudes to the left of the marble’s direction. How can that be?
Weather, Climate and SocietyNewton’s Laws of MotionUpper-Air Winds
Today’s Question…. Do Rocks Always Roll Downhill? PGF Upper-Level Winds Gedzelman, p 247
Newton’s Laws of Motion • Newton’s 1st Law An object at rest will remain at rest and an object in motion will remain at a constant velocity (same speed and same direction) if the net force exerted on it is zero An external force is required to speed up, slow down, or change the direction of air
Newton’s Laws of Motion • Newton’s 2nd Law The net force exerted on an object equals its mass times its acceleration Sum of All Forces = Mass x Acceleration Acceleration = Velocity Change / Time Acceleration = Change in Either Speed or Direction
New Velocity New Velocity Acceleration and Force Acceleration and Force Original Velocity Original Velocity New Velocity Original Velocity Original Velocity New Velocity Velocity, Acceleration and Force are Vectors • Speed/Size Change • Direction Change
New Velocity Acceleration directed toward center of circle Centripetal Original Velocity Uniform, Circular Motion Requires Acceleration Circular Path New Velocity Original Velocity
Accelerated Frame of Reference You are glued to car’s floor and drop an egg. What happens if the car begins to accelerate? Inside the car, it looks a mystery force is attracting the egg to the back of the car.Your frame of reference is accelerating. (rest) Someone outside the car sees that the egg is just accelerating to the floor, you are accelerating with the box car. A force is accelerating the car. Their frame of referenceis not accelerating. time Splat!
Life on a Rotating Platform • From perspective of person not on merry-go-round, path of ball is straight. • From perspective of person on merry-go-round, path of ball deflects to left. There is anapparent force. (left click picture for animation) World Weather Project 2010 Courtesy of M. Ramamurthy U of Illinois, Urbana-Champaign Merry Go Round Link
Earth’s Rotation Gedzelman, p 240 If viewed from space, earth is like a carousel! Northern Hemisphere rotates counterclockwise Southern Hemisphere rotates clockwise
Refinements Simple, right? But there are a couple of nuances We will consider both… Coriolis “force” varies with wind speed. The earth is a sphere, not flat like a carousel.
Ball Appears to Deflect to the Right of the Observer Deflection increases if: Speed of ball increases fast slow Gedzelman, p 242
Ball Appears to Go Straight Gedzelman, p 242 If the ball is thrown parallel to the axis of rotation, there is no apparent deflection
Deflection Depends on Orientation of Axis of Rotation and Velocity Apparent Deflection No Deflection velocity Gedzelman, p 242
Coriolis Force Varies with Latitude Gedzelman, p 243 Airplane Link
Geostrophic Adjustment • Parcel at rest initially accelerates toward lower pressure. • Coriolis Force rotates parcel to right in NH. • As parcel speeds up, Coriolis Force increases. • Eventually (about a day), PGF equals CF and flow is parallel to isobars. (left click picture to animate)World Weather Project 2010 Courtesy of M. Ramamurthy U of Illinois, Urbana-Champaign Animate Picture
Pressure Gradient Force 5640 m Geostrophic Wind 5700 m Coriolis Force Geostrophic Balance Geostrophic Wind Arises from a Balance Between the PGF and the Coriolis Force. PGF + Coriolis Force = 0 (Technically, it can only exist for East-West flow and for straight contours, but we will ignore that technicality.)
Pressure Gradient Force 5640 m Geostrophic Wind 5700 m Coriolis Force Geostrophic Balance The Balance Leads to the Wind Blowing Parallel to the Height Contours, with Lower Heights to the Left of the Wind Direction in the NH. Closer the Spacing Between the Height Contours- The Faster the Geostrophic Wind Speed.
PGF Cor Geo