Download
1 / 64
640 likes | 783 Views
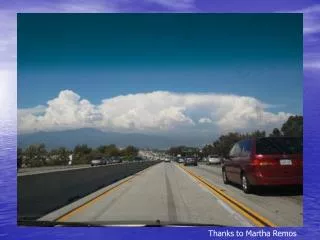
Thanks to Martha Remos. QUIZ RESULTS – Overal Scores. QUIZ RESULTS – Individual Questions. ESCI 106 – Weather and Climate Lecture 3. 9-1-2011 Jennifer D. Small . Weather Fact of the Day: September 1.

E N D
ESCI 106 – Weather and ClimateLecture 3 9-1-2011 Jennifer D. Small
Weather Fact of the Day: September 1 • 2008: A flash flood engulfed 4 hikers as they were trekking along the banks of River Prieto-River Blanco NW of Naguabo, PR. • Two escaped the flood surge, but two were swept away to their deaths • ~1.5 in of rain had fallen on parts of the El Yunque National Forest.
Temperature (from Chapter 2) • Temperature is a quantity that describes how warm or cold an object is. • It can also be described as: • a measure of the average kinetic energy of the atoms or molecules in a substance
Temperature (from Chapter 2) • Temperature video from online.. • http://www.atmosedu.com/meteor/Animations/TemperatureMolecular.mov
Air Temperature –why it’s important • It’s the first thing we usually think about when we talk about “weather” • Temperatures vary on different time scales • Seasonally, daily and even hourly • Temperatures vary all over the globe, by quite a bit.
Isotherms • We use Isotherms the distribution of temperature over a large area. • They are lines that connect points on a map that have the same temperature
Isotherms – Why do we care?? • Isotherms make it easier to read and analyze weather maps • By looking at patterns of temperature (and pressure) you can determine weather conditions in the next few days.
Air Temperature • Daily mean temperature • Average of 24 hourly readings • Adding maximum and minimum and dividing by two. • Example Maximum Temperature: 96 Minimum Temperature: 42 Daily Mean Temperature: (96 + 42)/2 = 69
Air Temperature • Daily Temperature Range • The difference between the maximum and minimum daily temperatures • Example Maximum Temperature: 96 Minimum Temperature: 42 Daily Temperature Range: (96 - 42) = 54
Air Temperature • Monthly mean temperature • Adding together the daily means for each day of a month and then dividing by the number of days in that month • Example Sum of Daily Means: 1216 Number of Days: 28 Monthly Temperature Mean: (1216/28) = 43.4
Air Temperature • Annual Mean Temperature • Adding together the monthly means and dividing by 12 • Example Sum of Monthly Means: 766 Number of Months: 12 Annual Mean Temperature: (776/12) = 63.8
Air Temperature • Annual Temperature Range • The difference between the warmest and coldest monthly mean temperatures • Example Warmest Monthly Mean Temperature: 95 Coldest Monthly Mean Temperature: 25 Annual Temperature Range: (95 - 42) = 70
What controls air temperature? • Differential Heating of land and water • Ocean Currents • Altitude • Geographic Position • Cloud cover and albedo
Land and Ocean – Differential Heating • Different surfaces absorb, emit and reflect different amounts of energy. • This causes variations in air above each surface
Land and Ocean – Differential Heating • In general: Land HEATS more rapidly and to HIGHER temperatures than Water. • In general: Land COOLS more rapidly and to LOWER temperatures than Water.
Land and Ocean – Differential Heating • Variations over Land are GREATER than variations over the Ocean!!! • The land surface has more variety…. • Trees • Streets • Buildings • Fields • Houses….
Ocean – Why is it more variable? • Surface temperature of water rises and falls slower than land • Water is highly mobile and mixes easily (think mixing red and blue dye… turns purple) • Daily changes are about 6 meters deep • Yearly ocean and deep lakes experience variations through a layer between 200-660 m thick!
Land – Why is this the case? • Heat does not penetrate deeply into soil or rock; it remains near the surface. • Rocks are not fluid… so no mixing • Daily temperature changes are seen only 10 cm down • Yearly temperature changes reach only 15 meters or less
Land and Ocean – Summer vs. Winter • During summer a thick layer of water is heated while only a thin layer of land is heated. • During winter the shallow layer of rock cools rapidly while the deeply heated water takes a longer time to cool. • as surface water cools it becomes heavier and sinks, replaced with warmer less dense water from below…. • This means the surface temperture of water doesn’t appear to change much
Land and Ocean – opaque vs. transparent • Because land surfaces are opaque heat is absorbed only at the surface • Water is transparent and lets energy from the sun penetrate to a depth of several meters
Land and Ocean – Specific Heat • The specific heat (the amount of heat needed to raise the temperature of 1 gram of water by 1 degree Celsius) is greater (~3 times) for ocean than land. • The OCEANS require MORE heat to raise its temperature the same amount as an equal quantity (grams) of land.
Land and Ocean – Evaporation • Evaporation is greater from Oceans than from Land • There’s more water molecules • Energy is required to evaporate water • When energy is used to evaporate water it is not available for heating. WATER WARMS MORE SLOWLY THAN LAND!!
Class Question?? • Which Hemisphere (north or south) has larger temperature variations? • Why?? The Northern Hemisphere has greater variations in temperature than the Southern Hemisphere There is more ocean than in the Southern Hemisphere. There is little land to interrupt the oceanic and atmospheric circulation. Thus, the SH has smaller variations in temperature.
Ocean Currents • Ocean currents are caused by wind (interactions between the atmosphere and ocean). • Energy passes from the atmosphere to the ocean via friction. • The DRAG exerted be the wind causes it to move
Ocean Currents • The transfer of heat by winds and ocean currents equalizes latitudinal energy imbalances
Ocean Currents – Poleward Currents Have a MODERATING effect !! • Warm water from the tropics travels up the coast via the Gulf Stream • It becomes the North Atlantic Drift and helps keep English and Irish weather mild. GULF STREAM!
Ocean Currents – Cold Currents Have a COOLING effect !! • Predominately influence the tropics during summer months • Happen in regions of costal upwelling • Associated with cool summers and fog CALIFORNIA CURRENT
Altitude • Atmospheric Lapse Rate: 6.5 C per km • Cooler temperatures at greater heights
Altitude • However, additional heating of the LAND (e.g. Mountain) causes the temperature to be WARMER than predicted by the lapse rate • Absorbtion and reradiation of solar energy by the ground surface keep places like Quito, Ecuador warmer than expected
Altitude • Again, atmospheric pressure and density decreases too so it absorbs and reflect less solar radiation.
Geographic Position • Leeward: prevailing winds blow TOWARDS the Ocean • Windward: prevailing winds blow From the Ocean to the SHORE WIND DIRECTION WIND DIRECTION Lacks Ocean Influence, More like Land Temperatures MORE VARIABLE TEMPERATURES Moderated by the Ocean air, cool summers-mild winters LESS VARIABLE TEMPERATURES
Cloud Cover and Albedo • Clouds cool during the day • High ALBEDO • Lower Maximum • Clouds warm at night • Trap OUTGOING Longwave radiation • Higher Minimum
WORLD DISTRIBUTION OF TEMPERATURES JANUARY • Decrease in Temperature from Equator to Poles • Warm colors to Cool colors JULY
WORLD DISTRIBUTION OF TEMPERATURES JANUARY • Latitudinal Shifting due to the seasonal migration of the Sun. • “HOT SPOTS” • Differential heating • Heating is largely a function of LATITUDE JULY
WORLD DISTRIBUTION OF TEMPERATURES • The hottest andcoldest places areover land. • Warm oceancurrents moving tothe Poles warm theair. • Equatorialbound currentsHelp cool the air.
WORLD DISTRIBUTION OF TEMPERATURES -40 Equatorial temperaturesdo not fluctuate significantly(there are no seasons). 25 -10 Middle and higher latitudeshave much stronger seasonalsignals. 25
CYCLES of AIR TEMPERAUTRE • Daily Temperature Variations • Magnitude of Daily Temp Changes Depends on • Variations in Sun angle (location) • Windward vs. leeward (location) • Clouds or no clouds (weather) • Amount of water vapor (weather) • Annual Temperature Variations • Months with highest and lowest mean T do not correspond to periods of max and min radiation • Shows that solar radiation isn’t the only thing governing surface temperatures,
TEMPERATURE MEASUREMENT • Mechanical thermometers • Electronic thermometers • Instrument shelters
Mechanical Thermometers • Most substances EXPAND and CONTRACT as a function of temperature… • Most thermometers use this principle. • Liquid-in-gas thermometers • Most common in daily use • Maximum Thermometers • Minimum Thermometers
Mechanical Thermometers • Bimetal strip • Consists of two thin strips of metal that are bonded together and have different expansion properties causing it to bend and curl.
Mechanical Thermometers • Thermograph • Uses a bimetal strip • Continuously measures temperature as the strip bends and flexes. • Pen records temperature on special paper. • Not as accurate as liquid-in-glass
Electric Thermometers • Thermistors are present in electric thermometers • Thermal resistor • As temperature increase so does the resistance, reducing the current • As temperature decreases, the resistance decreases allowing current to increase
Instrument Shelters • Where you take temperature matters • Instrument Shelters are: • White – for high albedo (reduce solar heating) • Ventilated – so it doesn’t get hot like your car • 1 meter high – reduce longwave heating
Temperature Scales • Fahrenheit • Celsius • Kelvin