Download
1 / 1
10 likes | 112 Views
Suzaku Observation of the Sagittarius D SNR region thermal emission from Sgr D SNR, 3-Iron lines and 593-sec period from SAX J1748.2-2808. Masayoshi Nobukawa , Makoto Sawada, Takeshi Tsuru, Hironori Matsumoto, Katsuji Koyama (Kyoto University) E-mail: nobukawa@cr.scphys.kyoto-u.ac.jp.

E N D
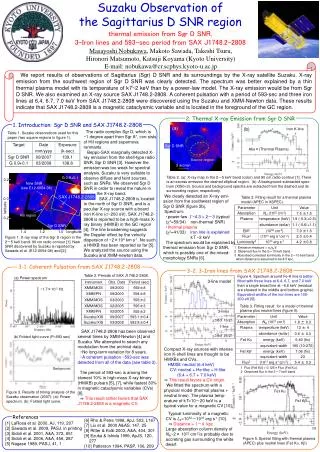
Suzaku Observation of the Sagittarius D SNR region thermal emission from Sgr D SNR, 3-Iron lines and 593-sec period from SAX J1748.2-2808 Masayoshi Nobukawa, Makoto Sawada, Takeshi Tsuru, Hironori Matsumoto, Katsuji Koyama (Kyoto University) E-mail: nobukawa@cr.scphys.kyoto-u.ac.jp We report results of observations of Sagittarius (Sgr) D SNR and its surroundings by the X-ray satellite Suzaku. X-ray emission from the southwest region of Sgr D SNR was clearly detected. The spectrum was better explained by a thin thermal plasma model with its temperature of kT~2 keV than by a power-law model. The X-ray emission would be from Sgr D SNR. We also examined an X-ray source SAX J1748.2-2808. A coherent pulsation with a period of 593-sec and three iron lines at 6,4, 6.7, 7.0 keV from SAX J1748.2-2808 were discovered using the Suzaku and XMM-Newton data. These results indicate that SAX J1748.2-2808 is a magnetic cataclysmic variable and is located in the foreground of the GC region. 2. Thermal X-ray Emission from Sgr D SNR 1. Introduction: Sgr D SNR and SAX J1748.2-2808 (a) (b) Iron K-line The radio complex Sgr D, which is ~1 degree apart from Sgr A*, con-sists of HII regions and supernova remnants. Beppo-SAX marginally detected X-ray emission from the shell-type radio SNR, Sgr D SNR [3]. However the emission was too weak for spectral analysis. Suzaku is very suitable to observe diffuse and faint sources, such as SNRs. We observed Sgr D SNR in order to reveal the nature in the X-ray band. SAX J1748.2-2808 is located to the north of Sgr D SNR, and is a peculiar X-ray source with a board iron K-line (s~200 eV). SAX J1748.2-2808 is reported to be a high-mass X-ray binary (HMXB) in the GC region [4]. The line broadening suggests the Doppler effect by the velocity dispersion of ~2×10⁴ km s-1. No such a HMXB has been reported so far [5]. We analyzed the source using the Suzaku and XMM-newton data. Table 1. Suzaku observations used for this paper (two square regions in figure 1). Sgr D SNR Abs×(Thermal Plasma) Source region 5 arcmin Table 2. (a): X-ray map in the 2-5 keV band (color) and 90 cm radio contour [1]. There is an excess emission the dashed elliptical region. (b): A background-subtracted spec-trum (XIS0+3). Source and background spectra are extracted from the dashed and its surrounding region, respectively. G 0.9+0.1 0.2 New SNR (see E12-0054-08) We clearly detected an X-ray emi-ssion from the southwest region of Sgr D SNR (figure 2b). Spectrum: ・power-law G~4.3 > 2-3 (typical (c2=59/34) non-thermal SNR) ・thermal plasma (c2=41/33) iron line is explained kT ~2 keV The spectrum would be explained by thermal emission from Sgr D SNR, which is possibly one of the mixed-morphology SNRs [6]. SAX J1748.2-2808 Table 2. Fitting result for a thermal plasma model (APEC in XSPEC). 0.0 latitude HII region -0.2 Sgr D SNR 1.4 1.2 1.0 longitude Figure 1. X-ray map of the Sgr D region in the 2-5 keV band. 90 cm radio contour [1]. New SNR discovered by Suzaku is reported by Sawada et al. (E12-0054-08) and [2]. 1 Emission measure = nenHV. 2 Observed flux in the 2ー10 keV band. 3 Absorbed-corrected luminosity in the 2-10 keV band. when distance is assumed to be 8.5 kpc. 3-1. Coherent Pulsation from SAX J1748.2-2808 3-2. 3-Iron lines from SAX J1748.2-2808 Table 3. Periods of SAX J1748.2-2808. Figure 4. Spectrum around Fe-K line is better-fitted with three lines at 6.4, 6.7, and 7.0 keV than a single broad line at ~6.6 keV (residual are showed in the middle and bottom graphs). Equivalent widths of the iron lines are 100-200 eV [9]. (a) Power spectrum 3-line model ~1.7×10⁻³ Hz Table 3. Fitting result for a model of thermal plasma plus neutral lines (figure 5). 3-lines c2/dof 16/21 1-line SAX J1748.2-2808 has been observed several times by XMM-Newton [4] and Suzaku. We attempted to search any modulation from the archival data. ・No long-term variation for 8 years. ・A coherent pulsation ~593-sec was detected from all of the data (see table 2). The period of 593-sec is among the slowest 10% in high-mass X-ray binary (HMXB) pulsars [5], [7], while fastest 30% in magnetic cataclysmic variables (CVs) [8]. ⇒ This result rather favors that SAX J1748.2-2808 is a magnetic CV. c2/dof 26/21 (b) Folded light curve (P=593 sec) Compact X-ray sources with intense iron K-shell lines are thought to be HMXBs and CVs. HMXB: neutral (6.4 keV) CV: neutral + He-like + H-like (6.4 + 6.7 + 7.0 keV) ⇒ This result favors a CV origin. We fitted the spectrum with a physical model (thermal plasma + neutral lines). The plasma temp-erature of kT=10-20 keV is a typical value for a magnetic CV [10]. • Flux (FeI Kb) = 0.125×Flux (FeI Ka) • 2 Observed flux in the 3-7 keV band. Background FeI Ka Figure 3. Results of timing analysis of the Suzaku observation (2007). (a): Power spectrum. (b): Folded light curve. FeI Kb Typical luminosity of a magnetic CV is LX=1032-1033 erg s-1 [10]. ⇒ Distance = 1-4 kpc Large absorption column density of NH~2× 1023 cm-2 is probably due to accreting gas surrounding the white dwarf. References [6] Rho & Petre 1998, ApJ, 503, L167 [7] Liu et al. 2000 A&AS, 147, 25 [8] Ritter & Kolb 2003, A&A, 404, 301 [9] Ezuka & Ishida 1999, ApJS, 120, 277 [10] Patterson 1994, PASP, 106, 209 [1] LaRosa et al. 2000, AJ, 119, 207 [2] Sawada et al. 2009, PASJ, in printing [3] Sidoli et al. 2001, A&A, 372, 651 [4] Sidoli et al. 2006, A&A, 456, 287 [5] Nagase 1989, PASJ, 41, 1 Figure 5. Spetral fitting with thermal plasma (APEC) plus neutral lines (FeI Ka, Kb)