Download
1 / 8
80 likes | 190 Views
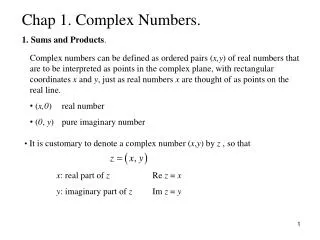
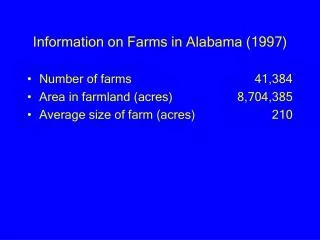
The Standard View of Farm Life in Alabama is That A Lot of Farmland Vanished. In fact, the situation is more complicated. Farmland was transformed. To see how, we have to look at some numbers. Table 1. Land In Farms (in acres, all numbers x 1000)

E N D
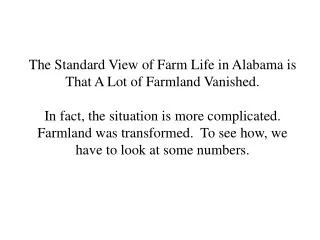
The Standard View of Farm Life in Alabama is That A Lot of Farmland Vanished.In fact, the situation is more complicated. Farmland was transformed. To see how, we have to look at some numbers.
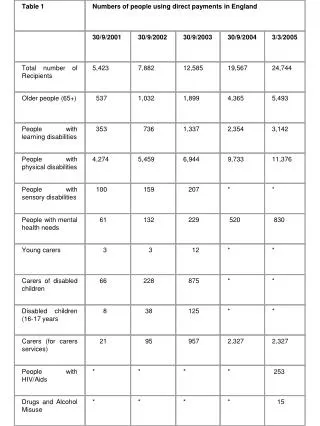
Table 1. Land In Farms (in acres, all numbers x 1000) USDA, Economic Research Service (ERS), "Farm Real Estate Historical Series Data, 1950-1992", Statistical Bulletin No. 855 A. B. Year Number of Farms Land in Farms 1950 220 21300 1954 168 21200 1959 129 17600 1964 102 16200 1969 85 15000 1974 78 14600 1978 59 12500 1982 55 11800 1987 49 10700 1992 46 9800
Most of it wasn’t actually pure farmland to begin with, so it didn’t actually disappear Most of it was actually mixed light pasture land with moderate hardwood tree cover. This mixed pasture land was converted to other uses, mostly forestland.
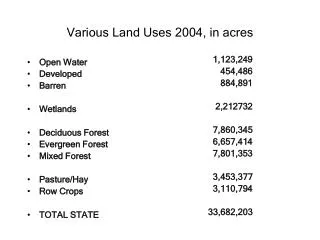
Table 2. Land Use (in acres, all numbers x 1000)USDA, Economic Research Service (ERS), “Major Land Uses 1945-1992", Stock No. 89003 A. B. C. D. E. Year Total Crop Total Forest Woodland Only Forest Only as PastureIncludingNoPastureGrazing1945 32690 8266 18748 4889 138591949 32690 8271 18817 8305 10512 1954 32690 7481 20766 10785 9981 1959 32678 6028 20771 16000 4771 1964 32545 5211 21749 17241 45081969 32452 5885 21748 19437 2311 1974 32452 5797 21333 19444 1889 1978 32452 5888 21333 19452 18811982 32491 5642 21179 19479 1700 1987 32491 4803 21659 19965 1694 1992 32480 4539 21941 20337 1604C (Total Forest) = D (Pure Forest) + E (Woodland as Pasture)
Confusion Occurs Because: -Sometimes “forestland” (D) is counted as including only “pure” forestland but not including any mixed tree-covered pasture land (E). This forestland (D) increased rapidly in extent. -Sometimes “forestland” (C) is counted as including both “pure” forestland (D) plus tree-covered pasture land (E). This Total Forestland (C) stayed fairly steady in extent.
These Major Changes Occurred: -The old mixed pasture land (E) was largely converted to forestland composed mostly of fast-growing evergreens -”Pure” cropland (B) diminished, but only by about half -Total farmland (see Table 1), including “pure” cropland (B) and mixed pastureland (E) , decreased considerably, primarily by conversion of old the mixed pasture land to forestland
Differing Points of View -To someone who sees only total farmland (from Table 1), it appears as if farming has collapsed -To someone who sees only pure cropland (B), farming declined steadily then bottomed out -To someone who sees only total forestland (C: including old tree-covered pasture land), forest cover has remained steady -To someone who sees only pure forestland (D), fast-growing evergreens replaced nearly all the old mixed pasture that was covered by hardwoods (E)