Download
1 / 23
230 likes | 354 Views
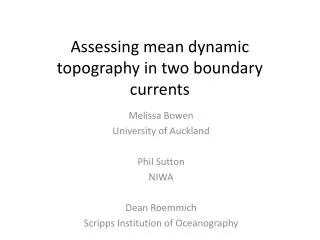
Assessing mean dynamic topography in two boundary currents. Melissa Bowen University of Auckland Phil Sutton NIWA Dean Roemmich Scripps Institution of Oceanography. MDT needed for mean currents and transport and to add to altimeter SLA to find total geostrophic currents.

E N D
Assessing mean dynamic topography in two boundary currents Melissa Bowen University of Auckland Phil Sutton NIWA Dean Roemmich Scripps Institution of Oceanography
MDT needed for mean currents and transport and to add to altimeter SLA to find total geostrophic currents. Level of no motion: CARS 2009 LNM 2000m (Ridgway and Dunn)
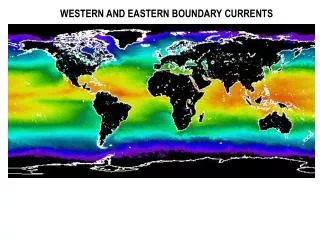
Satellite-derived MDT (gravity and altimeter): Combination of satellite data with in situ data: Maximenko et al., (2009) – drifters Tapley et al. (2003) MDT (from Maximenko et al., 2009)
Combination of gravity, altimeter, drifters, hydrography (Rio et al., 2005; Rio et al., 2011) CNES-CLS09 MDT (Rio et al., 2011) Other MDTs: Inverse methods, Ocean GCMS, State estimates
Comparisons of MDTs Boundary currents and the ACC regions with greatest differences between MDTs. Corrections in altimeter data may be limiting factor in advancing resolution of MDTs. Stammer et al., (2007); Vossepoel (2007); Griesel et al., (2012)
New Zealand: Several boundary current experiments along two altimeter tracks. LNM vs other MDTs? MDT derived from ARGO trajectories?
Subtropical (East Auckland Current) Subantarctic (Campbell Plateau SAF) • MDT using hydrography, altimeter and LNM • Mean surface currents and MDT from Argo trajectories • Comparison of MDTs along the tracks.
1) MDT using LNM • Mean has more structure when altimeter SLA is subtracted (solid) than dynhgt alone (dashed) • Subtracting altimeter SLA reduces total variance by 80%. • Variance not improved after fourth survey. • Remaining variance may be due to LNM assumption or altimeter signals/errors.
1) MDT using LNM • A constant value added to each profile to give each one the same mean, rms offset 3.6 cm • Offset would require LNM to move 60m • Offsets reduce to 2.8 cm rms with mapped SLA. • Both LNM and altimeter signals/errors contributing.
2) Argo trajectories Velocities at 1000m • Across-track component of velocities from Argo trajectories at 1000m (107 within 50 km of the track) • Show a strong East Auckland Current near the shelf and recirculation further north.
2) Argo trajectories • Use mean shear from the ten hydrographic surveys to estimate surface velocities • Average in 80km running mean • No improvement in variance if a fraction of the velocity anomaly from altimeter SLA subtracted from float velocities. Surface velocities
2) Argo trajectories Mean Surface Velocities Hydrography with 1800m LNM Argo trajectories + hydrography CNES-CLS09 Southward transport to 33S: 15 Sv (Argo, CNES) 29 Sv (LNM)
1) MDT using LNM Questionable improvement subtracting altimeter sea level anomaly.
2) Argo trajectories Velocities at 1000m • Across-track component of velocities from Argo trajectories at 1000m (184 within 50 km of the track) • Show a strong and variable SAF near the slope. • Average in 80km running means m/s Latitude on the altimeter line
2) Argo trajectories Hydrography with bottom LNM Argo trajectories + hydrography CNES-CLS09 Mean surface currents
Summary LNM with more sections not improving error in mean Mean surface velocities from Argo trajectories have lower error than those from LNM. Mean surface velocities from Argo trajectories more consistent with CLS09 than with the LNM. More work with trajectories: shear correction, refine location (use bathymetry?), adding a fine-scale, Argo-derived 0/1000m shear
Discussion Length scales in MSLA not good for subantarctic? Useful resolution in Argo trajectories. Map of along-track length scales = comparison between MSLA and SLA. Look also at Ducet et al., 2000 for covariance length scales, use Stammer definition of length scales for calculations. Argo – would be good to have some estimates of signal to noise at high resolution for the region to show what state trajectory data is at present.