Download
1 / 10
100 likes | 106 Views
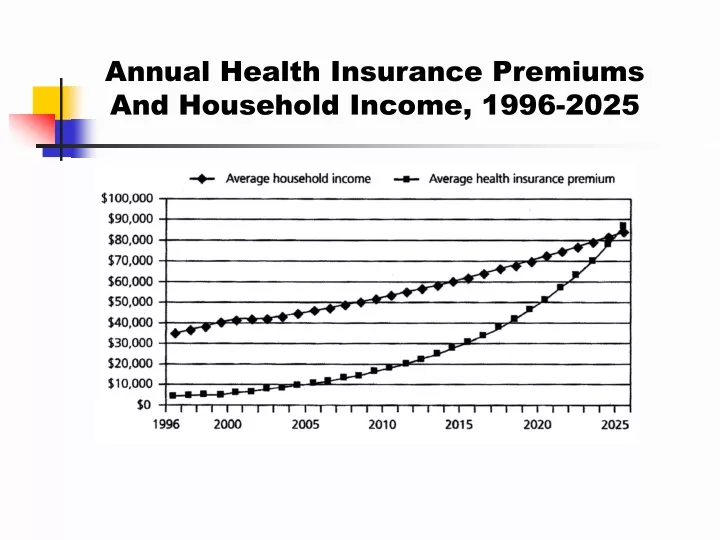
Annual Health Insurance Premiums And Household Income, 1996-2025. US Spending on Cancer Treatment continues to rise Total costs increased 35% from 2001 - 2011 Prescription drugs are 11.4% of Cancer Treatment Expenditures Drug costs alone rose $8 billion in 10 years, an increase of 500%.

E N D
Annual Health Insurance Premiums And Household Income, 1996-2025
US Spending on Cancer Treatment continues to rise • Total costs increased 35% from 2001 - 2011 • Prescription drugs are 11.4% of Cancer Treatment Expenditures • Drug costs alone rose $8 billion in 10 years, an increase of 500% *Center for Financing, Access, and Cost Trends, AHRQ, Household Component of the Medical Expenditure Panel Survey, 2001 and 2011
US cost of care can vary widely for routine medical procedures, hospital stays, and cancer drugs • Prescription Drug costs - 9% of Total US Healthcare Expenditures • Gleevec has had a much higher success rate for patients than many other high cost drugs *Data from International Federation of Health Plans 2013 Comparative Price Report
Rational Drug Design: A process for drug design which bases the design of the drug upon the structure of its protein target. • Structural mapping of the receptor (protein, P) active site • Identification of ligands (L) of complementary shape and appropriate functionality • Docking of the ligand to the receptor site - predicting a range of PL complexes with different DGPL values 4. Scoring i.e. ranking DGPL and correlating with experimentally determined properties such as IC50 values
HIV-1 Integrase Inhibitors DKAs DCQ acids; DCT acids PDP SQL Quinolone derived
L-Chicoric Acid and HIV-1 Integrase Healy et al., J Mol. Graph. Model. 2009, 27 , 14.
Surface representation showing Ile653 side chain in red. Electrostatic map of bound inhibitor
Tyrosine kinase inhibition: Ligand binding and conformational change in c-Kit and c-Abl FEBS Lett.2009, 583, 2899-2906.
ADAM Ligand Design Major determinant of potency and selectivity. Long chains can provide selectivity. Wide range of substituents tolerated. Charged polar groups influence bilary excretion. A zinc-binding group provides high affinity but low selectivity Wide range of substituents tolerated and are determinants of potency. Steric bulk beneficial for oral availability.