Download
1 / 45
450 likes | 580 Views
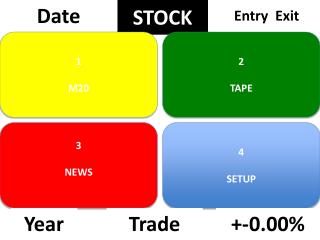
“How to Pinpoint Your Trade Entry and Exit Points for Maximum Profits and Minimum Losses!” An Introduction to T-Line Trading . From talking with my subscribers … ….and hundreds of other investors and traders over the years. it seems one of the biggest problems …

E N D
“How to Pinpoint Your Trade Entry and Exit Points for Maximum Profits and Minimum Losses!” An Introduction to T-Line Trading
From talking with my subscribers … ….and hundreds of other investors and traders over the years
it seems one of the biggest problems … …or mental blocks if you will - that keeps traders from being consistently successful boils down to …. …..ONE major thing
And, that one thing is knowingPrecisely when to enter a trade so you’re positioning yourself for the highest potential for gain
and then when to exit the trade to maximize your gain or to keep your loss to a minimum.
So if that sounds like an issue you’re having with your own trading, believe me… you’re not alone.
Heck, I remember when I first learned how to trade. I’ve said many times that when I first started trading… … I was the worst trader in the world!
I would watch a stock run for weeks or months, and finally decide to get in.
Yup! That was the EXACT TOP of the stock’s run, and then it promptly proceeded to crater, taking my hard-earned money right along with it.
It was so frustrating. It was like the stock was saying: Has that ever happened to you?
“OK, I’m gonna wait for Steve to get in, and then I’m going to plummet.”
Eventually, I got pretty good with my entries, and started getting in before a nice move.
But then, guess what happened? That’s right, I would stay in too long, and watch my precious profits disappear right before my eyes.
I obviously needed to figure out how to get IN a stock or other trade BEFORE its big move, and then how to get OUT of the trade BEFORE I lost all or most of my profits.
Well… as you know… about that time I discovered Japanese Candlesticks. And after many years of study, I mastered them, to the point of being able to generally recognize the appropriate entry and exit points of the trend reversals.
But I still wasn’t satisfied. I was still leaving a little too much money on the table. Or I would easily get whipsawed in and out of trades unnecessarily.
I decided I needed an even more precise system to further pinpoint the optimal entry and exit points of my trades.
So for many more years, I experimented and backtested dozens and dozens of different indicators combined with candlesticks.
I was looking for that “Holy Grail” trading system that hundreds of other traders have searched for over the decades.
I tested … stochastics volume MacD ….. Williams%R all sorts of moving averages, and numerous other indicators I can hardly pronounce.
And… after many late nights and bloodshot eyes… I finally found it.
It’s as close to a “Holy Grail” system as I’ve ever seen. And… oddly enough… one of the simplest to understand, learn and master.
Be fractal, in other words, work in all time frames, from 5 minutes to 5 months
So what is it based on? Let’s take a look… Obviously, we start out with a candlestick chart.
As far as additional indicators I found work the best, stochastics are crucial.
The other is a set of simple moving averages. Here I’m just talking about the simple 20, 50, and 200-day SMAs – the ones most of the other professional traders use.
These indicators give a quick, overall snapshot of where the stock or other entity is in its current state – overbought, oversold, etc.
But then I discovered the “Secret Sauce” that took this system to the next level.. It’s a certain type of moving average that seemed to flash clear, “can’t miss” warning signs of exactly what the stock was about to do next
I call this specialized moving average the T-Line. And I call my new trading system T-Line Trading
T-Line Simple Rule
T-line Simple rule
Now, why is the T-Line… combined with my other simple indicators… so powerful in pinpointing the ideal entry and exit points of any trade? Well, let’s look at some examples…
T-line assumption Easy visual recognition of a change in investor Sentiment.
So as you can see, once you master my simple T-Line Trading system, you’ll never have to worry about when to enter or exit a trade again.
If you get whipsawed out of a trade, you’ll have full confidence of when to get back in or just to stay out.
And with T-Line Trading, you’ll be able to maximize your gains, minimize your losses, and become the most confident, successful trader you’ve ever been.