Download

1 / 32
320 likes | 408 Views
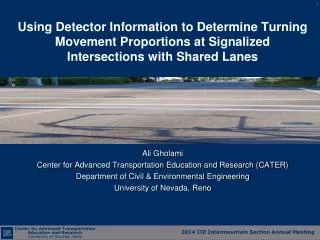
Using Detector Information to Determine Turning Movement Proportions at Signalized Intersections with Shared Lanes. Ali Gholami Center for Advanced Transportation Education and Research (CATER) Department of Civil & Environmental Engineering University of Nevada, Reno. Outline.

E N D
Using Detector Information to Determine Turning Movement Proportions at Signalized Intersections with Shared Lanes Ali Gholami Center for Advanced Transportation Education and Research (CATER) Department of Civil & Environmental Engineering University of Nevada, Reno
Outline • Volume application • Problem statement • Proposed methods • Case study intersections
Turning Movement Volume Applications • Intersection operational analyses • Traffic safety studies • Travel demand modeling • Identifying critical flow time periods • …
Loop Detector Data, High Resolution Sample data collected from the data communication adaptor Data Communication Adaptor
Determine Turning Movement Proportions at Signalized Intersections with Shared Lanes
Network Equilibrium (NE) Intersection j Intersection i
Determine Turning Movement Proportions at Signalized Intersections with Shared Lanes
Determine Turning Movement Proportions at Signalized Intersections with Shared Lanes
Determine Turning Movement Proportions at Signalized Intersections with Shared Lanes
How GP Works? • GP is based on evolution process, (cross over, mutation, and elitism) • We can use ready applications
Accuracy MAPE: Mean Absolute Percentage Error Di: the detector data value Bi: the reference (base) data value n: the total number of intervals
Case Study Intersections 8th Street and Center Street 9thSt. and Sierra St. N McCarran Blvd and Clear Acre Ln
Errors using inadequate data are much less than those using no data at all.
Thank you Any comments or questions? If we have data, let’s look at data. If all we have are opinions, let’s go with mine! Jim Barksdale, former Netscape CEO