Download
1 / 34
340 likes | 483 Views
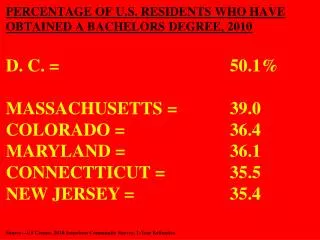
PERCENTAGE OF U.S. RESIDENTS WHO HAVE OBTAINED A BACHELORS DEGREE, 2010. D. C. = 50.1% MASSACHUSETTS = 39.0 COLORADO = 36.4 MARYLAND = 36.1 CONNECTTICUT = 35.5 NEW JERSEY = 35.4 Source—US Census, 2010 American Community Survey, 1-Year Estimates.

E N D
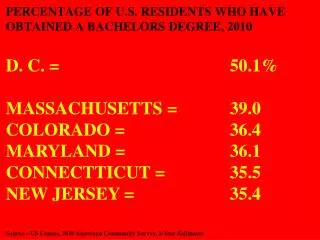
PERCENTAGE OF U.S. RESIDENTS WHO HAVE OBTAINED A BACHELORS DEGREE, 2010 D. C. = 50.1% MASSACHUSETTS = 39.0 COLORADO = 36.4 MARYLAND = 36.1 CONNECTTICUT = 35.5 NEW JERSEY = 35.4 Source—US Census, 2010 American Community Survey, 1-Year Estimates
PERCENTAGE OF U.S. RESIDENTS WHO HAVE OBTAINED A BACHELORS DEGREE, 2010 VIRGINIA = 34.2 VERMONT = 33.6 NEW HAMPSHIRE = 32.8 NEW YORK = 32.5 MINNESOTA = 31.8 WASHINGTON = 31.1 ILLINOIS = 30.8 RHODE ISLAND = 30.2 CALIFORNIA = 30.1
PERCENTAGE OF U.S. RESIDENTS WHO HAVE OBTAINED A BACHELORS DEGREE, 2010 KANSAS = 29.8 HAWAII = 29.5 UTAH = 29.3 MONTANA = 28.8 OREGON = 28.8 NEBRASKA = 28.6 ALASKA = 27.9 STATE AVERAGE = 27.9
PERCENTAGE OF U.S. RESIDENTS WHO HAVE OBTAINED A BACHELORS DEGREE, 2010 DELAWARE = 27.8 NORTH DAKOTA = 27.6 GEORGIA = 27.3 PENNSYLVANIA = 27.1 MAINE = 26.8 NORTH CAROLINA = 26.5 SOUTH DAKOTA = 26.3 WISCONSIN = 26.3 ARIZONA = 25.9 TEXAS = 25.9 FLORIDA = 25.8 MISSOURI = 25.6 MICHIGAN = 25.2 NEW MEXICO = 25.0
PERCENTAGE OF U.S. RESIDENTS WHO HAVE OBTAINED A BACHELORS DEGREE, 2010 IOWA = 24.9 OHIO = 24.6 SOUTH CAROLINA = 24.5 IDAHO = 24.4 WYOMING = 24.1 TENNESSEEE = 23.1 OKLAHOMA = 22.9 INDIANA = 22.7 NEVADA = 21.7 LOUISIANA = 21.4 ALABAMA = 21.9 KENTUCKY = 20.5 ARKANSAS = 19.5 MISSISSIPPI = 19.5 WEST VIRGINIA = 17.5
Latinos, 25-Years & Up, 2011Less than 9th Grade = 5.51 million, 20.7%9th to 12th Grade = 4.00, 15.0%High School graduate = 7.96, 29.8%Some College/Assoc. Degree = 5.44, 20.4%Bachelor’s Degree = 2.67, 10.0%Advanced Degree = 1.09, 4.1%Source: US Census Bureau, Current Population Survey, Annual Social & Economic supplement, 2011
US Latinos, Nursery School* 2011 --White = 1.33 Million --Hispanic = 0.77 [26.6%] --Black = 0.56 --Asian = 0.12 --TOTAL = 2.90 *--Enrollmemt on Public Nursery Schools by 3-yrs. old and up Source: Hispanic Student Enrollments reach new Highs in 2011, PEW Hispanic Center, August 20, 2012
US Latinos, Kindergarden* 2011 --White = 1.90 Million --Hispanic = 0.98 [26.3%] --Black = 0.50 --Asian = 0.19 --TOTAL = 3.73 *--Enrollmemt on Public Kindergarden Schools by 3-yrs. old and up Source: Hispanic Student Enrollments reach new Highs in 2011, PEW Hispanic Center, August 20, 2012
US Latinos, Elementary School* 2011 --White = 15.67 Million --Hispanic = 7.40 [24.7%] --Black = 4.66 --Asian = 1.34 --TOTAL = 29.97 *--Enrollmemt on Public Elementary Schools by 3-yrs. old and up Source: Hispanic Student Enrollments reach new Highs in 2011, PEW Hispanic Center, August 20, 2012
US Latinos, High School* 2011 --White = 8.54 Million --Hispanic = 3.29 [26.5%] --Black = 2.55 --Asian = 0.64 --TOTAL = 12.43 *--Enrollmemt on Public High Schools by 3-yrs. old and up Source: Hispanic Student Enrollments reach new Highs in 2011, PEW Hispanic Center, August 20, 2012
US Latinos High School Completion Rate for 18 to 24 yrs. olds Latinos: --2000 = 59% --2011 = 76% Source: Hispanic Student Enrollments reach new Highs in 2011, PEW Hispanic Center, August 20, 2012
US Latinos, College* 2011 --White = 7.88 Million --Hispanic = 2.08 [16.5%] --Black = 1.64 --Asian = 0.75 --TOTAL = 12.57 *--Enrollmemt in Colleges by 18 to 24-year-olds. Source: Hispanic Student Enrollments reach new Highs in 2011, PEW Hispanic Center, August 20, 2012
US Latinos, In College* 2011 --Asians = 79.4% --Whites = 75.9% --Blacks = 65.6% --Latinos = 56.3% *--Of All Attending College, Percent Enrolled in four-year Colleges, ages 18 to 24 Source: Hispanic Student Enrollments reach new Highs in 2011, PEW Hispanic Center, August 20, 2012
US Latinos, In College* 2011 --Asians = 20.6% --Whites = 24.1% --Blacks = 34.4% --Latinos = 43.7% *--Of All Attending College, Percent Enrolled in two-year Colleges, ages 18 to 24 Source: Hispanic Student Enrollments reach new Highs in 2011, PEW Hispanic Center, August 20, 2012
US Latinos—Education*, ‘10 Source: Pew Hispanic Center, August, 2011 --Asians = 62% --Whites = 43% --Blacks = 38% --Latinos = 32% *--Percent Enrolled in College, ages 18 to 24
Median Household Income, ‘10 Source: New York Times, September, 15,2011 --Asians = $64,308 --Whites = $54,620 --Blacks = $32,068 --Latinos = $37,379
“Hispanic students accounted for more than half of all eight graders in California in 2011, the highest proportion in the country. But only 14% of those students were proficient on eight-grade reading tests….” Source: New York Times, February 22, 2013
US Latinos--Education --What role should YOU play in increasing Latino HS enrollment & completion? --Do YOU see it as a role you should play?
US Latinos—Education… --For the 9.51 million adult Latinos in our country that have less than a high school education, what’s their future like? --What’s the country’s current adult education capabilities?
US Latinos—Education… --Latinos represent 23% of all 5-to-17-yrs.-olds in our country, what’s their future like? --What’s the country’s future like if current Latino college enrollment continues into the future?
US Latinos—Education… --About 10.0% of Latinos 25-yrs. and older have a bachelor’s degree, whereas 32,1% of non-Hispanic Whites do—how difficult is it and how long will it take to get the Latino rate on par with non-Hispanic Whites?
Per-Pupil Costs/Yr. --$15,969 for MPS, ‘11 --$9,718 for Milwaukee independent charter schools, ‘11 --$4,442 for Milwaukee voucher students, ‘11 Source: Milwaukee Journal/Sentinel, January 18, ‘13
Segregation in Public Schools --43% of Latinos in schools with < 10% whites, ‘09-’10 --38% of Blacks in schools with < 10% whites, ‘09-’10 --Approx. 15% of Latinos & Blacks in schools with < 1% white,’09-’10 --”Latino segregation more pronounced in CA, NY, & TX” Source: New York Times, September 20, ‘12