Download
1 / 27
670 likes | 1.39k Views
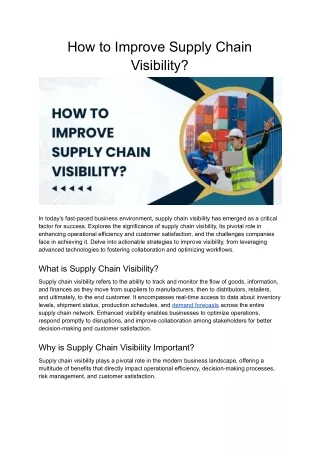
Supply Chain Visibility. Bill Gilmour. Today’s key message: Visibility too good to have, but it’s not as easy as you may think!. The collective insights from 400 Supply Chain Executives identified five major challenges and Visibility was No.1 Source: IBM Chief Supply Chain Office Survey.

E N D
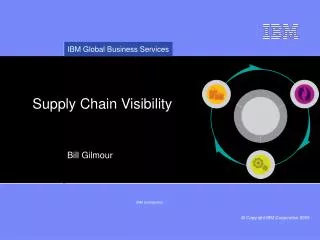
Supply Chain Visibility Bill Gilmour
Today’s key message: Visibility too good to have, but it’s not as easy as you may think! The collective insights from 400 Supply Chain Executives identified five major challenges and Visibility was No.1 Source: IBM Chief Supply Chain Office Survey 70% 55% 60% 56% 43% COST CONTAINMENT SUPPLY CHAIN VISIBILITY RISK MANAGEMENT INCREASING CUSTOMER DEMANDS GLOBALIZATION Lead times, delivery, and quality are top challenges, but overall globalization has been a positive boon for all. Fighting integral costs as such as might be futile, but being flexible can identify cost savings elsewhere Process, data, & technology are identified as the roadblocks to good risk management, yet they are the key enablers. Supply chain visibility is inhibited by a lack of capabilities and an unwillingness to collaborate. Customers have increased demand for more precise synchronization of supply and demand. Based on responses of “to a very great extent” and “to a significant extent”
Implementation is patchy, but is distinctive in top performing supply chains. It is worth it! Percentage of organisations that have implemented Visibility solutions “Driving integration and visibility of information inside our recipients’ organisations ranks fourth on their priority list, and external visibility falls even lower – in seventh place. Though it may seem logical to blame poor visibility and collaboration on inadequate IT, supply chain executives point elsewhere. Not surprisingly, organisational silos are the biggest barrier. But we were shocked at how many executives reported that their organisations are too busy to share information or simply do not believe collaborative decision making is that important.” * Top supply chains determined based on respondents’ ranking in AMR Research Supply Chain Top 25 for 2008
70% 30% 300 million $50+ billion annually The percentage of the world’s fresh water supply used by agriculture. Of the food purchased in the developed nations is going to waste Pounds of meat and poultry recalled in the US in the last 15 years Or 3-5% of sales lost due to supply chain inefficiencies 1600 miles How far a typical carrot travels before it is purchased by the consumer. The need for progress is already clear…..
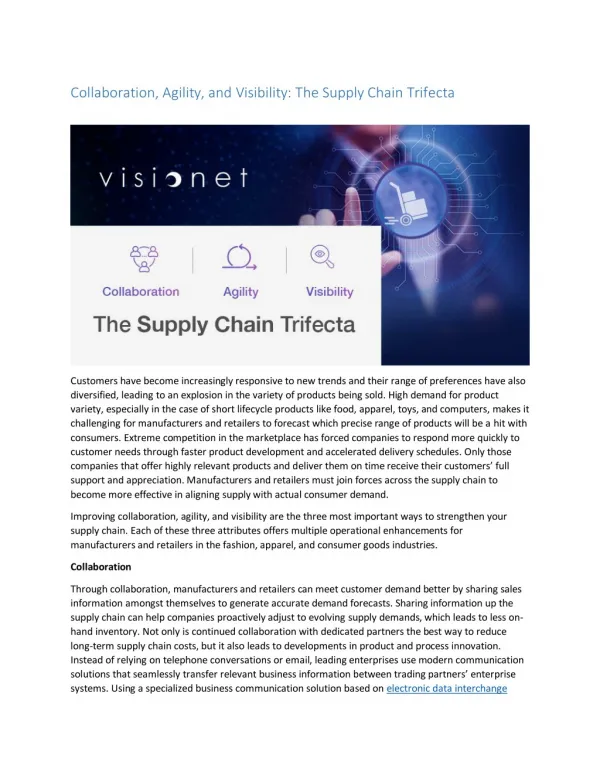
So, the key questions for the presentation are: • What do we mean by Supply Chain Visibility, and do we all mean the same thing? • What are the issues and barriers? • Case studies, why is visibility such a hot topic? What benefits does it provide? • What do you have to get right? Its not all about technology
What do we mean by Supply Chain Visibility, and do we all mean the same thing? • Visibility of; • Products whereabouts / status • Real time demand and demand plans • Supply plans • Inventory levels by location • Orders • And visibility of assets e.g; • Vehicles, condition and capacity • People and capabilities If you can’t measure it, you can’t manage it!
The Supply Chain of the Future must be SMARTER...It will be Instrumented, Interconnected & Intelligent Automated Transactions & Smart Devices • Use of sensors, actuators, RFID, & smart devices to automate transactions: inventory location, shelf-level replenishment detection, transportation locations & bottlenecks • Supports real-time data collection & transparency from POS to manufacturing to raw material • Sense-and-respond demand/supply signals allow “predict and act” Instrumented Optimized Flows • Multi-Tier system integration across the network. Standardized data and processes. • Collaborative decision making through decision support and business intelligence – starting with the customer • Networked risk management programs for integrated financial controls with operational performance – monitored and measured Interconnected Networked Planning, Execution & Decision Analysis • Simulation models to evaluate trade-offs of cost, time, quality, service and carbon and other criteria • Probability-based risk assessment & predictive analysis • Networked planning/execution with optimized forecasts & decision support Intelligent
CSCO How can it be so very difficult when we have the ability to use all these assets: Our Point of View on the Progression of Supply Chain Management to a Smarter Future Smart Supply Chain Future External Collaboration & Integration Networked Planning, Flexibility & stability Execution & Decision Analysis Effectively driving profitable growth Intelligent Horizontal Process Integration Optimized Flows Balancing risk and performance Interconnected Functional Excellence Integrated Static Supply Chain Transactions (ERP to ERP) Managing complexity Instrumented Automated Transactions (Sensors & Actuators)
To step forward a business needs to align each dimension Processes Supply Chain Optimisation Integrate with Customers & Suppliers Systems People Virtual Supply Chain Synchronisation of Supply with Demand Advanced Decision Support Inter-business Working External Collaboration Reliability & Flexibility Cross-functional working Internal Communications Functional Working Transaction Processing Simplification & Control Data Accuracy Skills & disciplines Performance Measures Leadership & Vision Program Management + + Establishing the starting point focuses the action plans
S&OP S&OP Case study 1. IBM: An electronics manufacturer needing to control its supply to assure availability Lack of timely information on forecast, supply, or customer orders results in additional costs such as premium routing or redistribution Lack of visibility into supplier inventory leads to stock outs, late/expedited shipments, quality issues, etc. Source: Line56 2003 Lack of visibility into changing supplier commits can lead to inaccurate customer commitments or financial projections Inability to receive timely, accurate demand signals leads to stock outs, excess/obsolete inventory, higher cost, lost revenue, and poor customer satisfaction. Sales & Operations Planning Process Lack of visibility and timely information lengthens the cash-to-cash cycle, reducing profitability
Virtual Command Centre Case study 1. IBM: Our response is a “Virtual Command Centre”, providing access to our customers and suppliers’ planning data • Demand Driven Replenishment • Demand Forecasting • Inventory Optimization • Proactive Buy-Sales Decision • Event Management • S&OP Support Reseller Supplier Shipment Consumer Distributor Forecast Distributor Shipment POS Recomm Inv Logistics Hub Inv Volume Demand Hub Customer Shipment Purchase Order • Track and Trace • Route Optimisation • KPI Visibility Forecast Commit • Inventory Optimisation • Supplier Collaboration • KPI Visibility • Dynamic Supply Demand Balancing Supply Hub Recomm Inv Inv Volume Purchase Order
Case study 2. GS1 “Data Crunch” project focussed on data quality between UK Retailers and Consumer Product companies • The project is supported by four top UK grocery retailers and three top suppliers • Each had provided a snapshot of their supply chain master data for analysis which is over one million records • IBM is providing software and related services to assist GS1 UK • The objective is address a knowledge gap in the grocery industry as retailers and suppliers often have incomplete data, leading lead to costs within the supply chain. • Benefits are anticipated in the following three main areas; • Reductions of cost in manual workarounds to source missing data and correct errors • Reduced shrinkage administrative costs • Reduction in lost consumer sales through shelf stock- outs • Our data will be used to quantify the UK retailers and suppliers profit erosion and lost sales. A resulting white paper which assesses the impact and opportunities is scheduled for issue later in the year Source: British Retail Consortium Issue 14 July- August 2009
Factory Wholesaler C&FA/Depot Distributor Retailer Consumer Case study 3 Improved Distributor Management in Growth Markets The Scope • 30+ Factories • 45 Carrying & Forwarding Agents (C&FAs) • 5,000+ Distributors spread across the country • 1 million Retailers • Distributors are remotely located and not able to remain online all time • Huge amount of data needs to be handled • High transaction monthly cycle Need for a distributor collaboration system
Case study 3 Improved Distributor Management in Growth Markets Objectives • Capture Secondary Sales – Accurately, In Detail and Without Phase Lag • Ensuring price and TPM benefits reach the last link in the Chain – the Retailer • Paperless office – Do away with cumbersome claim process • Standardize Data structures Solution • Data is moved to “Push pull” synchronization engine from central database and the Distributor can sync and get updated schemes, price & SKU info • The system is able to extract data from all Distributors and put it in a central system • This data is then put into an extract and sent to SAP BIW system High Level Architecture Integration & Harmonization External Data Internal Data Push Pull RS Unify Central Unify Legacy Systems Central Unify Database RS Unify Database Sync Database Products Prices Scheme Messaging Publish Trade Marketing Schemes BIW RS Unify Users define Sync profiles Workflow Workflow APIs User Interface User Interface User Analytics
Case study 4 A common data strategy to enable multiple analytical solutions
Case study 4. Using analytics to create demand through consumer insights fulfilled by a demand driven repository • Analytics Providers • IRI • Nielsen Analytics Results Consumers Demand Data Syndicated Data Enterprise Reporting KPIs, Alerts Insights and Collaboration Platform Aggregate Data • Shopper Insights Analysis • Dynamic Pricing • POS Data • Demand/Supply Planning • Category Management • Promotion Planning Insights Master Data Business Rules Bottlers Retailers
Case study 5 End to end visibility allows optimisation of Supply Chain, Costs and Carbon Footprint Solution Objectives • Link operational decisions to “Board Room” view (P&L impact estimation) • Model sustainability in broader sense (operational, financial, environmental) • Integrate key supply chain planning areas in one model (inventory, network, routing) • Create an inventory of all energy using equipment and quantify energy use in relation to supply chain decisions • Provide extensive “what-if” analysis to help establish cost effective sustainability policies • Provide a user friendly web-based integrated dashboard 2 RDC’s – Regional Distribution Centers 29 FDC’s – Forward Distribution Centers 26,000 customer locations >2000 suppliers >25,000 products B$ 106 Sales B$ 8.5 inventory Vendors S-RDC (Denver) RDC (Memphis) Executive Policy P&L Impact Energy & CO2 optimization Network optimization National Whole Sale Warehouses Inventory optimization Vehicle routing optimization FDC FDC Operational Metrics Operational actions Hospitals Independent Retailer Clinics & Doctors National Whole Sale Stores Customer clusters
Several very different case studies, so there’s no single right solution. Enabling technology falls into a number of groups • Optimisation tools that allow you to do something useful with the information • Tools and sensors for real-time data capture • Portals for the capture of suppliers’ data • Integration hubs for the creation of end-to-end visibility
Summary: Supply Chain Visibility is on everyone’s list of challenges, but no one has solved all the issues • Visibility can be equally applicable to products, assets and people Three Keys to success • Rule 1: Form the right collaborative relationships with your customers and suppliers. • Rule 2: Visibility must be actionable. • Rule 3: Work on those areas of your business that will give the greatest benefit • It is not all about technology – but you need that too. • There are many solutions out there. They should be selected and scaled to address the specific needs of your supply chain. Questions
2008 Apple Nokia Dell Procter & Gamble IBM Wal-Mart Stores Toyota Motor Cisco Systems Samsung Electronics Anheuser-Busch PepsiCo Tesco The Coca-Cola Company Best Buy Nike Sony Ericsson Walt Disney Hewlett-Packard Johnson & Johnson Schlumberger Texas Instruments Lockheed Martin Johnson Controls Royal Ahold Publix Super Markets 2007 Nokia Apple Procter & Gamble IBM Toyota Motor Wal-Mart Stores Anheuser-Busch Tesco Best Buy Samsung Electronics Cisco Systems Motorola The Coca-Cola Company Johnson & Johnson PepsiCo Johnson Controls Texas Instruments Nike Lowe's GlaxoSmithKline Hewlett-Packard Lockheed Martin Publix Super Markets Paccar AstraZeneca 2007 Nokia Apple Procter & Gamble IBM Toyota Motor Wal-Mart Stores Anheuser-Busch Tesco Best Buy Samsung Electronics Cisco Systems Motorola The Coca-Cola Company Johnson & Johnson PepsiCo Johnson Controls Texas Instruments Nike Lowe's GlaxoSmithKline Hewlett-Packard Lockheed Martin Publix Super Markets Paccar AstraZeneca 2009 Apple Dell Procter & Gamble IBM Cisco Systems Nokia Wal-Mart Stores Samsung Electronics PepsiCo Toyota Motor Schlumberger Johnson & Johnson The Coca-Cola Company Nike Tesco Walt Disney Hewlett-Packard Texas Instruments Lockheed Martin Colgate Palmolive Best Buy Unilever Publix Super Markets Sony Ericsson Intel Kennedy Information ranks IBM as a leader in supply chain consulting
Operating Efficiently Collaboration & Supplier Integration Typical Exam Question How can I better integrate with my suppliers to reduce time to order and improve every day interactions ? Next gen EDI platform that analyses communications in real time, adds intelligent analysis and alerts to issues PORTAL Supplier Compliance OUR PROPOSITION EDI Order Lifecycle Management Inventory utilisation E.G 6 month implementation SaaS, hosted & financed Flexible Commercial models PO to delivery EDI costs ATP Open2Buy OTIF BENEFIT 40% 43% 20-40% Process productivity
Operating Efficiently Supply Chain Transformation Exam Question How can I optimise my supply chain without making substantial infrastructure change Use of intelligent algorithms proven in retail supply chains to improve utilisation of resources & stock holding Labour Optimisation Safety Stock Planning Resource Utilisation NetworkDesign StockOptimisation OUR PROPOSITION TransportPlanning Stock Utilisation Transform to pull replen inc’ safety stock setting Store Forecasting & Replen E.G 6 month implementation Proof of concept Business case based on mathematical evaluation Stock holding 30% 2-3% BENEFIT Working capital Scheduling time
Delivering Change Intelligent Cost Reduction I want to find a partner who can look at my complete business and identify large cost reduction opportunities Exam Question Financial review to identify areas of consolidation, improved process and outsourcing based on best practice Offer & Assets • Our Proposition • Take 20-40% out of the targeted cost base • Reduce costs in operations expenditure, both now and in the future • Improve cash flow • Reduce working capital • Disposals of underperforming or non strategic assets • Use alternative sources of funding • Improve “control” over spending • Improve quality & predictability in decisions • Support globalisation of capabilities • Manage or improve service levels • Strategic business alignment and service value focus • Create or sustain capability to support new business ventures and products/services • AND re-align organisation and workforce 12 month payback Commit to commercial outcomes Flexible commercial models Our Approach $500m supply cost reduction 50% performance incr’ in app development $40m savings from cross business cost reduction
Case study 4. A Global Oil Major wanting to track its tankers and improve control of delivery schedules • If petrol station managers are allowed to order when they want to, the supply chain will never be optimal for the supplier • Peaks and troughs through the week caused by consumer demand and pricing fluctuations • Order volumes causing tankers to go out half full • Integration between scheduling centres, terminals, trucks and customers assured robust planning and collaboration • petrol station managers know when deliveries will arrive, and can be ready • Schedulers can maximise the deliveries in a shift • Drivers can know whether tank space is going to be available to receive their loads
Case study 4. Solution technology includes sensors, communications infrastructure and optimisation systems At scheduling centre At customer site Tank gauging Modem Service to poll data into central database Optimising / Scheduling system Interface to ERP / other systems On delivery vehicle Communication between truck and customer GPRS modem In-Cab Touch PC In-Cab Software