Download
1 / 11
110 likes | 239 Views
Mining Mouse Vocalizations. Jesin Zakaria Department of Computer Science and Engineering University of California Riverside. Mouse Vocalizations. 100. kHz. l aboratory mice. 40. 124. 125. Time (second).

E N D
Mining Mouse Vocalizations JesinZakaria Department of Computer Science and Engineering University of California Riverside
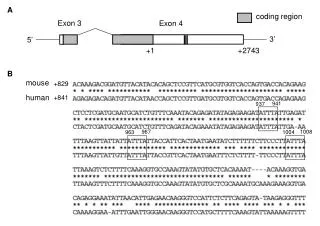
Mouse Vocalizations 100 kHz laboratory mice 40 124 125 Time (second) Figure 1: top) A waveform of a sound sequence produced by a lab mouse, middle) A spectrogram of the sound, bottom) An idealized version of the spectrogram
Figure 1 : ) Two 0.5 second spectrogram top representations of fragments of the vocal output of a male mouse. ) Idealized (by human intervention) versions bottom of the above The intution behind symbolizing the spectrogram 2 Figure 3: The two fragments of data shown in Figure 2.bottom aligned to produce the maximum overlap. (Best viewed in color) Figure 4: The data shown in Figure 2 augmented by labeled syllables C Q A X X X X P P A
Background Time (sec) 90.1 91.1 120 Figure 5: A snippet spectrogram that has seven syllables 4 8 original kHz 1 1 1 7 3 0 8 4 110 idealized 30 78 76.3 Time (second) Figure 6: top) Original spectrogram, bottom) Idealized spectrogram (after thresholding and binarization) Figure 7: left) A real spectrogram of a mouse vocalization can be approximated by samples of handwritten Farsi digits (right). Some Farsi digits were rotated or transposed to enhance the similarity
Extracting syllables from spectrogram connected components I SP L Figure 8: from left to right)snippet spectrogram, matrix corresponding to an idealized spectrogram I, matrix corresponding to the set of connected components L, mbrs of the candidate syllables
Editing Ground truth a b c d e f Figure 9: Sixteen syllables provided by domain experts A B C D E F G H A B C D E F G H I J K L M N O P I J K L M N O P New Class g h ij k Figure 11: Ambiguity reduction of the original set of syllable classes. Representative examples from the reduced set of eleven classes are labeled as small letters
Editing Ground truth for edited ground truth 1 for all the labeled syllables 0.8 0.6 Classification Accuracy 0.4 0.2 0 0 100 200 300 400 500 600 700 Adding more instances Figure 10: Thick/red curve represents the accuracy of classifying syllables of edited ground truth. Thin/blue curve represents the accuracy of classifying 692 labeled syllables using edited ground truth
Data mining Mouse Vocalizations Clustering mouse vocalizations ciaciaci ciaciaci ccccccgc ecccccc dcibfcd eccccccc ccccccgc ddcibfcd Figure 12: A clustering of eight snippets of mouse vocalization spectrograms using the string edit distance on the extracted syllables (spectrograms are rotated 90degrees for visual clarity) Figure 13: A clustering of the same eight snippets of mouse vocalization shown in Figure 12 using the correlation method. The result appears near random
Data mining Mouse Vocalizations Similarity search / Query by content ciafqcicia Edit dist 2 ciqbqcaacja Edit dist 3 Figure 14: top) A query image from [1], The syllable labels have been added by our algorithm to produce the query ciabqciacia, bottom) the two best matches found in our dataset; corresponding symbolic strings are ciafqcicia and ciqbqcaacja, with edit distance 2 and 3, respectively c query image c c c i i i q query image b c c a c a a Figure 15: top) The query image from [2] was transcribed to cccc. Similar patterns are found in CT (first row) and KO (second row) mouse vocalizations in our collection [1] J. M. S. Grimsley, et al., Development of Social Vocalizations in Mice. PLoS ONE 6(3): e17460 (2011). [2] T. E. Holy, Z. Guo, Ultrasonic songs of male mice, PLoSBiol 3(12): e386, (2005).
Data mining Mouse Vocalizations motif 16 40 3983 30 # of substrings (log scale) 118 44 20 16 11 18 10 0 0 0.5 1 1.5 2 2.5 3 3.5 Z-score i j i c c a a c a i i motif 1 i Assessing Motif Significance using z-score c c c a a a motif 2 c g c c c c c c c g b c c c c q c c 194.8 – 195.2 sec 944.7 – 945.2 sec 17
Contrast set mining Overrepresented in Knock-out Overrepresented in Control using information gain Figure 18: Examples of contrast set phrases. top) Three examples of a phraseciacia that is overrepresented in KO, appearing 24 times in KO but never in CT. bottom) Two examples of a phrase dccccc that appears 39 times in CT and just twice in KO