Download
1 / 18
180 likes | 308 Views
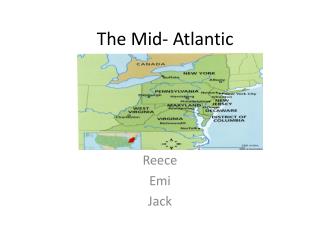
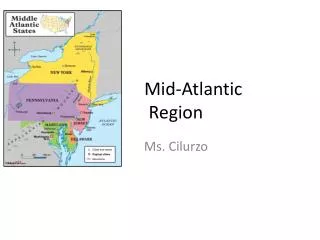
Predicting Acid Neutralizing Capacity for the Mid-Atlantic Highlands Region. Brett Kellum Jennifer Hoeting N. Scott Urquhart Colorado State University September 21, 2002. FUNDING SOURCE.

E N D
Predicting Acid Neutralizing Capacity for the Mid-Atlantic Highlands Region Brett Kellum Jennifer Hoeting N. Scott Urquhart Colorado State University September 21, 2002
FUNDING SOURCE • This presentation was developed under the STAR Research Assistance Agreement CR-829095 awarded by the U.S. Environmental Protection Agency (EPA) to Colorado State University. This presentation has not been formally reviewed by EPA. The views expressed here are solely those of its authors and the STARMAP Program. EPA does not endorse any products or commercial services mentioned in this presentation.
Introduction A. What is Acid Neutralizing Capacity (ANC)? B. Remotely sensed model predictors C. Data source: EMAP - Mid-Appalachian Highlands Region Assessment
Predictors Considered for Model • Elevation • Bedrock Geology (with 5 classes) • 13 Thematic Mapper Imagery Classifications • Alber’s Projection Coordinates • Strahler Order • Final data set contains 238 sites
Final Predictors in current “best” Regression Model (Transformations) Response: Acid Neutralizing Capacity (log) Predictors: % Probable Row Crops % Pasture (log) % Urban – High Density (log) % Emergent Wetlands (log) % Woody Wetlands (log) % Quarry Elevation Carbonate Bedrock Felsic Bedrock Model Summary R2 = 0.58 Overall p-value <.0001
V. Areas of Further Research More work in the area of anisotropic spatial models Including interaction terms in the model Weighted Least Squares Predictive ability of models in other areas of MAHA
Coefficients: Value Pr(>|t|) (Intercept) 7.8 <.0001 pasture 0.0361 0.0169 probable 0.0133 0.0184 row.crops 0.0102 0.5017 decid -0.0025 0.3589 mixed 0.0554 0.1624 evergreen -0.0210 0.1991 urb.hi 0.0437 0.0713 urb.low 0.0247 0.1898 emergent 0.0559 0.0160 woody -0.0468 0.0203 transition -0.0030 0.8109 quarry 0.0113 0.4649 water -0.0110 0.5110 elev -0.0007 0.0006 carbon 0.4408 0.0302 felsic -0.2392 0.2233 arg 0.0356 0.8480 silic -0.0211 0.9144 ord2 -0.1206 0.1630 ord3 -0.1471 0.1355 X -0.0841 0.1223 Y -0.0846 0.0649 X^2 0.0058 0.8951 Y^2 -0.1141 0.0155 X*Y 0.1067 0.0748 Multiple R-Squared: 0.6394 Overall p-value is <.0001 Coefficients: Value Pr(>|t|) (Intercept) 7.4355 <.0001 probable 0.0119 0.0008 pasture 0.0529 <.0001 urb.hi 0.0686 0.0002 emergent 0.0446 0.0369 woody -0.0694 0.0003 quarry 0.0260 0.0750 elev -0.0005 0.0007 carbon 0.5215 <.0001 felsic -0.2935 0.0040 Multiple R-Squared: 0.5784 Overall p-value is <.0001