Download
1 / 26
270 likes | 561 Views
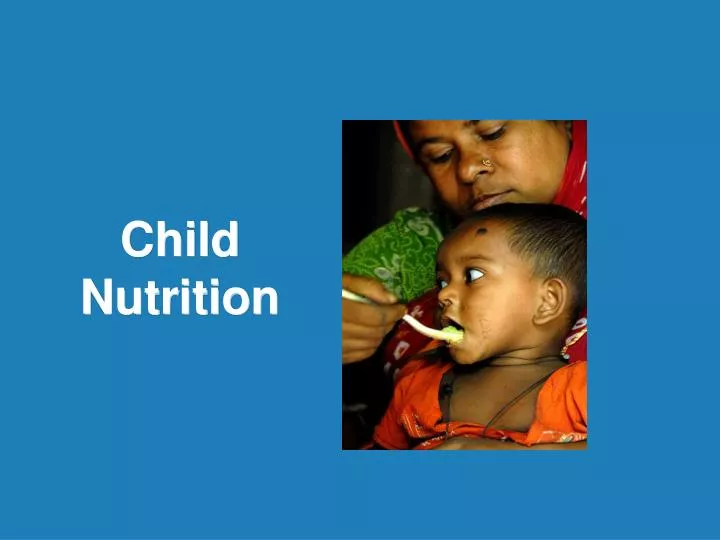
Child Nutrition. Measuring undernutrition. Clinical assessment Obvious wasting, Edema Anthropometric measurements Biochemical assessment Blood tests Dietary assessment Survey of food eaten. http://www.globalaware.org/Images/MLW112sm.jpg. Anthropometric measurements. Weight Height

E N D
Measuring undernutrition • Clinical assessment • Obvious wasting, Edema • Anthropometric measurements • Biochemical assessment • Blood tests • Dietary assessment • Survey of food eaten http://www.globalaware.org/Images/MLW112sm.jpg
Anthropometric measurements • Weight • Height • Mid-upper Arm Circumference • Head circumference • Chest circumference • Skinfold thicknesses • Comparisons made to reference population
Anthropometric indicators • Stunting • Low height for age • Underweight • Low weight for age • Wasting • Low weight for height Same age girls
Stunting • Stunting: low height for age • Over 200 million children are stunted • 40% of all preschool children in developing countries http://lh3.ggpht.com/_B9ewHcmqIAA/RpwXq1CfJ1I/AAAAAAAAAss/V145foIlbcw/Kenya+2007+1401.jpg
Stunting http://www.theglobaleducationproject.org/earth/images/final-images/stunting-map.gif
Underweight • Low weight for age • 150 million children are underweight • 26% of world’s children http://www.squidoo.com/make_a_difference
Underweight http://www.msf.org.za/MalnutritionCampaign/pics/map_hotspots_large.jpg
Wasted • Below normal weight for height • 52 million children are wasted • Two thirds of these live in Asia • half in South Asia http://www.sfgate.com/c/pictures/2006/03/30/mn_africa26_032_mac.jpg
Mid Upper Arm Circumference(MUAC) • Easy way to determine undernutrition in preschool children • upper arm circumference doesn’t change much • Normal • Over 13.5 cm • Severely Acute Malnutrition • Under 11.5 cm http://www.cooler-marketing.com/img/MUAC31.jpg
Body Mass Index (BMI) • The BMI is defined as weight in kilograms divided by height in metres squared (kg/m2). • A cut-off point of 18.5 is used to define thinness or acute undernutrition and a BMI of 25 or above indicates overweight or obesity. A BMI of 17.0-18.4 refers to mildly thin and <17.0, refers to moderately/severely thin. A BMI of over 30.0 refers to obesity. • The BMI data discussed excludes women who were pregnant at the time of the survey and women who gave birth during the two months preceding the survey.
Undernutrition • About 55% of the 11 million deaths among under-five children each year in the developing world are associated with undernutrition http://www.unicef.org/sowc98/figure1.gif
Target Population for Nutrition Interventions Stunted Under weight Wasted Nearly 30% of the children start at a disadvantage at birth with Low birth weight The proportion of underweight and stunted children rises from 6 moths onwards plateaus at 24 months Window of Opportunity: -9 to +24 months
Target population for Nutrition Interventions • Key Points: Target group for nutrition programmes • Under five Children with a focus on under twos • Women during pregnancy and lactation • Adolescents (10-19 years)
Mother and Child Protection Card Unified Mother and Child protection card as a tool for growth monitoring and counseling Wt/age (underweight) measured at the field level in AWC and VHNDs Ht/Age and Wt/Ht (wasting) to be measured at health facility level Use of new WHO Child Growth Standards – use of separate charts for girls and boys and use of Z score
Demistifying ECD – Age appropriate Play and Communication activities
What is Growth Monitoring • Growth monitoring comprises a package of activities: • regularly measuring the weight of children; • plotting the information on a growth chart to make abnormal growth visible; • if growth is abnormal (usually faltering), the health worker does something, in concert with the mother; • as a result of these actions, the child's nutrition improves, the child receives appropriate social or medical support, or doctors are able to diagnose early serious disease.
Growth Monitoring • An opportunity for health promotion. • Discussion around feeding, hygiene, and other aspects of the child's health and behaviour. • A way of reassuring parents, and convincing them of the value of good nutrition. • Adds value as far as the parents are concerned to existing child activities in clinics
More in rural(71.5) as compared to urban (63) areas Varies from 76% in lowest wealth index to 52% in highest No sex differentials Anemia in children 6 – 59 months Severe Anemia No Anemia Moderate Anemia Mild Anemia