Download

1 / 40
400 likes | 525 Views
Relating Gene Expression to a Phenotype and External Biological Information. Richard Simon, D.Sc. Chief, Biometric Research Branch, NCI http://linus.nci.nih.gov/brb. Good Microarray Studies Have Clear Objectives. Gene Finding Class Comparison

E N D
Relating Gene Expression to a Phenotype and External Biological Information Richard Simon, D.Sc. Chief, Biometric Research Branch, NCI http://linus.nci.nih.gov/brb
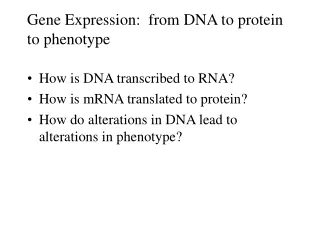
Good Microarray Studies Have Clear Objectives • Gene Finding • Class Comparison • Find genes whose expression differs among predetermined classes • Find genes whose expression is correlated with quantitative measure or survival • Class Prediction • Prediction of predetermined class (phenotype) using information from gene expression profile • Class Discovery • Discover clusters of specimens having similar expression profiles • Discover clusters of genes having similar expression profiles
Class Comparison and Class Prediction • Not clustering problems • Global similarity measures generally used for clustering arrays may not distinguish classes • Don’t control multiplicity or for distinguishing data used for classifier development from data used for classifier evaluation • Supervised methods • Requires multiple biological samples from each class
Major Flaws Found in 40 Studies Published in 2004 • Cluster Analysis of samples • 13/28 studies invalidly claimed that expression clusters based on differentially expressed genes could help distinguish clinical outcomes • Outcome related gene finding • 9/23 studies had unclear or inadequate methods to deal with false positives • 10,000 genes x .05 significance level = 500 false positives • Supervised prediction • 12/28 reported a misleading estimate of prediction accuracy • 50% of studies contained one or more major flaws
Levels of Replication • Technical replicates • RNA sample divided into multiple aliquots and re-arrayed • Biological replicates • Multiple subjects • Replication of the tissue culture experiment
Biological conclusions generally require independent biological replicates. • Analyses should distinguish biological replicates from technical replicates • The power of statistical methods for finding differentially expressed genes depends on the number of biological replicates. • For class comparison with a common reference design, dye swap technical references are not needed
Common Reference Design A1 A2 B1 B2 RED R R R R GREEN Array 1 Array 2 Array 3 Array 4 Ai = ith specimen from class A Bi = ith specimen from class B R = aliquot from reference pool
The reference generally serves to control variation in the size of corresponding spots on different arrays and variation in sample distribution over the slide. • The reference provides a relative measure of expression for a given gene in a given sample that is less variable than an absolute measure. • The reference is not the object of comparison. • The relative measure of expression will be compared among biologically independent samples from different classes.
Class Comparison Blocking • Paired data • Pre-treatment and post-treatment samples of same patient • Tumor and normal tissue from the same patient • Blocking • Multiple animals in same litter • Any feature thought to influence gene expression • Sex of patient • Batch of arrays
Technical Replicates • Multiple arrays on the same RNA sample • Analyses should distinguish biological replicates from technical replicates • Select the best quality technical replicate or • Average expression values over technical replicates
t-test Comparisons of Expression for Gene j • xj~N(j1 , j2) for class 1 • xj~N(j2 , j2) for class 2 • H0j: j1 = j2
Estimation of Within-Class Variance • Estimate separately for each gene • Limited degrees-of-freedom (precision) unless number of samples is large • Gene list dominated by genes with small fold changes and small variances • Assume all genes have same variance • Poor assumption • Random (hierarchical) variance model • Wright G.W. and Simon R. Bioinformatics19:2448-2455,2003 • Variances are independent samples from a common distribution; Inverse gamma distribution used • Results in exact F (or t) distribution of test statistics with increased degrees of freedom for error variance • For any normal linear model
Simple Control for Multiple Testing • If each gene is tested for significance at level and there are n genes, then the expected number of false discoveries is n . • e.g. if n=1000 and =0.001, then 1 false discovery • To control E(FD) u • Conduct each of k tests at level = u/k
False Discovery Rate (FDR) • FDR = Expected proportion of false discoveries among the tests declared significant • Studied by Benjamini and Hochberg (1995):
If you analyze n probe sets and select as “significant” the k genes whose p ≤ p* • FDR ~ n p* / k
Limitations of Simple Procedures Based on Univariate p values • p values based on normal theory are not accurate in the extreme tails of the distribution • Difficult to achieve stringent significance levels for permutation p values of individual genes with small numbers of samples • Multiple comparisons controlled by adjustment of univariate p values do not take account of correlation among genes
Additional Procedures • “SAM” - Significance Analysis of Microarrays • Tusher et al., 2001 • Multivariate permutation tests • Korn et al., 2001 • Control number or proportion of false discoveries • Can specify confidence level of control
Multivariate Permutation Test(Korn et al., 2001) Allows statements like: FD Procedure: We are 95% confident that the (actual) number of false discoveries is no greater than 5. FDP Procedure: We are 95% confident that the (actual) proportion of false discoveries does not exceed .10.
Biological Annotations of Differentially Expressed Genes • Types of annotations • GO, pathways • pubmed citations • published signatures • TF targets • Built-in annotations in statistical software used to generate the list of differentially expressed genes • Submitting the list of differentially expressed genes to a website or program that does annotations
Over-Representation Analysis • 10,000 genes on array • 100 genes found differentially expressed between phenotype classes • O = observed number of differentially expressed genes in specified GO set • e.g O = 10 • 200 genes on array in specified GO set • E = Expected number of differentially expressed genes in specified GO set • E = (200/10,000)*100 = 2.0
Limitation of Over-Representation Analysis • Gene list is usually based on stringent significant threshold • Number of individual genes is large • Statistical power for identifying differentially expressed genes is limited and therefore list is often incomplete • Construction of list of differentially expressed genes based on univariate analysis of individual genes does not permit results for genes in set to reinforce each other for detecting differentially expressed gene set
Gene Set Enrichment Analysis and Variants • Compute p value of differential expression for each gene in a gene set (k=number of genes) • Compute a summary (S) of these p values • Average of log p values • Kolmogorov-Smirnov statistic; largest distance between the cumulative distribution of the p values and the uniform distribution expected if none of the genes were differentially expressed • Modified K-S statistic • Average of t statistics • P value for regression model on all genes in set under assumption that regression coefficients come from common N(0,v) distribution
Null Hypotheses for Gene Set Enrichment Analyses • Determine whether the value of S is more extreme than would be expected if none of the genes in the set were differentially expressed • Permute class labels randomly and re-calculate p values and summary S • Repeat for all or many permutations and generate the distribution of S under the null hypothesis • Compute p*=the proportion of the random permutations gave a value of S at least as great as with the true class labels • Determine whether the value of S is more extreme than would be expected from a random sample of k genes on that platform
Gene Set Expression Comparison • p value for significance of summary statistic need not be as extreme as .001 usually, because the number of gene sets analyzed is usually much less than the number of individual genes analyzed • Conclusions of significance are for gene sets in this tool, not for individual genes
Comparison of Gene Set Expression Comparison to O/E Analysis in Class Comparison • Gene set expression tool is based on all genes in a set, not just on those significant at some threshold value
P Pavlidis, DP Lewis, WS Noble. Pac Symp Biocomp, 474-85, 2002 • VK Mootha, CM Lindgren, KF Eriksson, A Subramanian, et al. Nature Genetics 34:267-73, 2003 • P Pavlidis, J Qin, V Arango, JJ Mann, E Sibille. NeurochemicalResearch 29:1213-22, 2004 • JJ Goeman, SA van de Geer, F de Kort, HC van Houwelingen, Bioinformatics 20:93-99, 2004 • A Subramanian, P Tamayo, VK Mootha, et al. PNAS 102:15545-50, 2005 • WT Barry, AB Nobel, FA Wright. Bioinformatics 21:1943-49, 2005 • L Tian, SA Greenberg, SW Kong, JAltschuler, IS Kohane, PJ Park, PNAS 102:13544-49, 2005 • SW Kong, WT Pu, PJ Park, Bioinformatics 22:2373-80, 2006