Solving Linear Programs: Graphical Method & Computer Solutions
Learn how to solve linear programs using graphical technique and computer programs, gaining insight into theory while focusing on software applications. Dr. C. Lightner from Fayetteville State University guides you through graphical solutions for LP models.

Solving Linear Programs: Graphical Method & Computer Solutions
E N D
Presentation Transcript
Solving Linear Programs (LP Section 2) • Chapter 2 (Revisited) Graphical Method • Computer Solutions Using LINDO Interpreting Computer Output for LP Section 1 problems Dr. C. Lightner Fayetteville State University
Solving Linear Programs • The goal of a linear program is to find the values of your xj variables that provide the largest (or smallest) possible objective value when substituted into the objective function. • The Graphical Method can be used to solve the LP for these values when you have one or two decision variables. This technique helps to visualize key LP concepts. • Computer Programs are generally used to solve all LP problems. • We will learn to use the graphical method to solve small problems and gain insight into some theory behind solving LPs. Nevertheless, we will focus on using a computer software to solve our LP models. Dr. C. Lightner Fayetteville State University
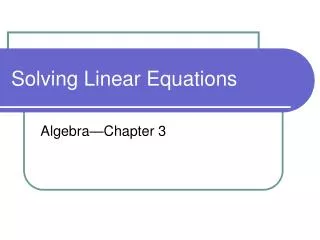
Solving LPs using the Graphical MethodChapter 2 • We begin the graphical solution process by graphing each linear constraint of the LP model on the same graph. • Refer to the PAR, INC example from Section 1 of your LP notes. Maximize 10 x1 + 9 x2 Subject to: 7/10 x1 + 1 x2 ≤ 630 1/2 x1 + 5/6 x2 ≤ 600 1 x1 + 2/3 x2 ≤ 708 1/10 x1+ 1/4 x2 ≤ 135 x1 ≥ 0, x2 ≥ 0 Dr. C. Lightner Fayetteville State University
Graphical Method: PAR, INC • Constraint 1 (C1): 7/10 x1 + 1 x2≤ 630 Always graph constraints as an equality. In order to graph a line we need two points that fall on the line. Arbitrarily, let x1 =0. Then 7/10 (0) + x2 =630. Solving this equation for x2 gives x2 =630. Therefore one point on this line is (0, 630). Arbitrarily, let x2 =0. Then 7/10 x1 + (0) =630. Solving this equation for x1 gives x1 =6300/7=900. Therefore a 2nd point on this line is (900, 0). Connect the points (0, 630) and (900,0) to draw this line. • Determine the Feasible Side of the Line: In LP, on one side of the line all points are feasible (i.e. they satisfy the constraint) and on the other side all points are not feasible. For instance take the point (0,0). The point x1 =0 and x2 =0 satisfy the above constraint [7/10 * (0) + (0) is less than 630]. Thus all points that are on the side of the line containing this point will also satisfy this constraint. We put a red arrow to indicate the feasible side of the line. Dr. C. Lightner Fayetteville State University
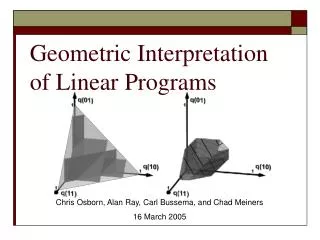
Graphical Method: PAR, INC x2 C1 x1 Dr. C. Lightner Fayetteville State University
Graphical Method: PAR, INC Constraint 2 (C2): 1/2 x1 + 5/6 x2≤ 600 In order to graph a line we need two points that fall on the line. Arbitrarily, let x1 =0. Then 1/2 (0) + 5/6 x2 =600. Solving this equation for x2 gives x2 =720. Therefore one point on this line is (0, 720). Arbitrarily, let x2 =0. Then x1 =1200. Therefore a 2nd point on this line is (1200, 0). Connect the points (0, 720) and (1200,0) to draw this line. • Determine the Feasible Side of the Line: Use the point (0,0) as a test point. Since x1 =0 and x2 =0 satisfies the above constraint [1/2 * (0) + 5/6 (0) is less than 600]. Thus all points on the side containing the point (0,0) will satisfy this constraint. We put a red arrow to indicate the feasible side of the line. Dr. C. Lightner Fayetteville State University
Graphical Method: PAR, INC C2 x2 C1 x1 Dr. C. Lightner Fayetteville State University
Graphical Method: PAR, INC • Constraint 3 (C3): 1 x1 + 2/3 x2 ≤ 708 In order to graph a line we need two points that fall on the line. Arbitrarily, let x1 =0. Then x2 =1062. Therefore one point on this line is (0, 1062). Arbitrarily, let x2 =0. Then x1 =708. Therefore a 2nd point on this line is (708, 0). Connect the points (0, 1062) and (708,0) to draw this line. • Determine the Feasible Side of the Line: Using our test point point (0,0), we find that x1 =0 and x2 =0 satisfies the above constraint [1 * (0) + 2/3 (0) is less than 708]. Thus all points on the side containing the point (0,0) will satisfy this constraint. We put a red arrow to indicate the feasible side of the line. Dr. C. Lightner Fayetteville State University
Graphical Method: PAR, INC C3 x2 C1 C2 x1 Dr. C. Lightner Fayetteville State University
Graphical Method: PAR, INC • Constraint 4 (C4): 1/10 x1+ 1/4 x2 ≤ 135 Arbitrarily, let x1 =0. Then x2 =540. Therefore one point on this line is (0, 540). Arbitrarily, let x2 =0. Then x1 =1350. Therefore a 2nd point on this line is (1350, 0). Connect the points (0, 540) and (1350,0) to draw this line. • Determine the Feasible Side of the Line: Using our test point (0,0), we find that x1 =0 and x2 =0 satisfies the above constraint [1 * (0) + 2/3 (0) is less than 708]. Thus all points on the side containing the point (0,0) will satisfy this constraint. We put a red arrow to indicate the feasible side of the line. Dr. C. Lightner Fayetteville State University
Graphical Method: PAR, INC C3 x2 C1 C4 C2 x1 Dr. C. Lightner Fayetteville State University
Graphical Method: PAR, INC • Nonnegativity Constraints These constraints simply restrict us to the 1st quadrant of our coordinates (i.e. only 0 or positive values of x1 and x2 are considered feasible on our graph when we highlight our final feasible region). Dr. C. Lightner Fayetteville State University
Graphical Method: PAR, INC C3 x2 C1 C4 C2 x1 Dr. C. Lightner Fayetteville State University
Graphical Method: PAR, INC • After graphing each of the constraints and their feasible sides individually, we must determine all points on the coordinates which satisfy all constraints. These points make up the feasible region. Dr. C. Lightner Fayetteville State University
PAR, INC GRAPHICAL METHODFEASIBLE REGION C3 C1 x2 C4 x1 Dr. C. Lightner Fayetteville State University
FEASIBLE REGION • Once the feasible region is drawn, we must determine the point in this region that maximizes (or minimizes) the objective function. Dr. C. Lightner Fayetteville State University
Extreme Points and the Optimal Solution • The corners or vertices of the feasible region are referred to as the extreme points. • Fundamental Theorem of Linear Programming An optimal solution to an LP problem can be found at an extreme point of the feasible region. • Optimal point occurs on the objective function line corresponding to the optimal objective function value • When looking for the optimal solution, you do not have to evaluate all feasible solution points. • You have to consider only the extreme points of the feasible region. Dr. C. Lightner Fayetteville State University
PAR, INC GRAPHICAL METHODFEASIBLE REGION AND EXTREME POINTS x2 x1 Dr. C. Lightner Fayetteville State University
Finding the Optimal Point How to find the optimal point • Randomly draw objective function line. • Push the line in the “direction of decrease” (if minimization problem) or the “direction of increase” (if maximization problem) • The last point that you encounter in the feasible region is the optimal point Dr. C. Lightner Fayetteville State University
Drawing an Objective Function Line • Randomly select a point in the feasible region. • Substitute the coordinates of this point into the objective function to obtain an objective function value. • Plot the line obtained by setting the original objective function equal to the objective function value obtained in 2. PAR, INC Example Step 1: The point (200,0) is in the feasible region. Step 2: PAR INC OBJECTIVE FUNCTION 10 x1 + 9 x2 . (200,0) gives 10 (200) + 9 (0)= 2000. Step 3: Plot the line 10 x1 + 9 x2 =2000. Connect the points (0, 222.22) and (200, 0) Dr. C. Lightner Fayetteville State University
PAR, INC GRAPHICAL METHODFEASIBLE REGION AND EXTREME POINTS x2 Obj. Func. line x1 Dr. C. Lightner Fayetteville State University
FINDING THE DIRECTION OF INCREASE (For Maximization problems) • Maximization problem: Finding the direction of increase • Let v1= the coefficient of x1 in the objective function. • Let v2= the coefficient of x2 in the objective function. • Plot the point (v1, v2) on the graph. • Draw an arrow from the origin (the point x1=0, x2=0) to the point (v1,v2). This is the direction of increase. Push the objective function in this direction until you encounter the last point in the feasible region. This point is optimal. Dr. C. Lightner Fayetteville State University
FINDING THE DIRECTION OF DECREASE (For Minimization problems) • Minimization problem: Finding the direction of decrease • Let v1= - (the coefficient of x1 in the objective function). • Let v2= - (the coefficient of x2 in the objective function). • Plot the point (v1, v2) on the graph. • Draw an arrow from the origin (the point x1=0, x2=0) to the point (v1,v2). This is the direction of decrease. Push the objective function in this direction until you encounter the last point in the feasible region. This point is optimal. Dr. C. Lightner Fayetteville State University
PAR INC GRAPHICAL METHOD • PAR INC objective function is Maximize 10 x1 + 9 x2 Thus v1=10 and v2=9. I can draw an arrow from the origin in the direction of the point (10,9). This is the direction of increase. Dr. C. Lightner Fayetteville State University
PAR, INC GRAPHICAL METHODFEASIBLE REGION AND EXTREME POINTS x2 Direction of Increase This is the optimal point. Obj. Func. line x1 Dr. C. Lightner Fayetteville State University
PAR, INC GRAPHICAL METHODFEASIBLE REGION AND EXTREME POINTS x2 Slide 15 shows that the optimal point is formed by the intersection of Constraint 1 and Constraint 3. x1 Dr. C. Lightner Fayetteville State University
PAR INC GRAPHICAL SOLUTION Constraint 1: 7/10 x1 + 1 x2= 630 Constraint 3: 1 x1 + 2/3 x2 = 708 Find the point where these two lines intersect. Solve the first equation for x2: x2= 630-7/10 x1 Substitute the above equation for x2 in the 2nd equation. 1 x1 + 2/3(630-7/10 x1)=708 Solving the above equation for x1 gives, x1 = 540. Thus x2= 630-7/10 (540)= 252. The optimal point denoted x1*=540, x2*=252. Dr. C. Lightner Fayetteville State University
PAR INC GRAPHICAL SOLUTION • If we substitute the optimal point x1*=540, x2*=252 into the objective function, 10 (540)+ 9 (252)= 7668. • Thus PAR INC should produce 540 Standard bags and 252 Deluxe bags to receive a maximum profit of $7668. Dr. C. Lightner Fayetteville State University
Discussion about the Graphical Method • Refer to Additional Graphical Method Problems link in LP Section 2 folder and/ or your textbook for more practice solving problems via the graphical method. • You will have one homework (containing 2 problems) dedicated to this approach. YOU WILL NOT HAVE TO SOLVE A PROBLEM USING THIS TECHNIQUE ON AN EXAM. • This approach to solving Linear Programming models allows us to visualize the process that computer software use to soft LP models. • Computer software use the knowledge that the optimal point is an extreme point of the feasible region (There are characteristics of extreme points that allow the computer to recognize them). The software will “intelligently” search these extreme points to determine the optimal solution to an LP model. Dr. C. Lightner Fayetteville State University
Computer Solutions • Computer programs designed to solve LP problems are now widely available. • Most large LP problems can be solved with just a few minutes of computer time. • Small LP problems usually require only a few seconds. • We will use LINDO to solve our LP problems. Dr. C. Lightner Fayetteville State University
Using LINDO to Solve • Look in the LP Section 2 folder and click on the link Downloading Free LINDO Software and follow the instructions. • The Par Inc file located in this folder is a MS Word file which explains how to enter (and solve) a program in LINDO. • Enter the other examples presented in this chapter into LINDO. Dr. C. Lightner Fayetteville State University
Interpretation of Computer Output We will discuss the following output: • objective function value • values of the decision variables • reduced costs • slack/surplus Dr. C. Lightner Fayetteville State University
Reduced Cost • The reduced cost for a decision variable whose value is 0 in the optimal solution is the amount the variable's objective function coefficient would have to improve (increase for maximization problems, decrease for minimization problems) before this variable could assume a positive value. • The reduced cost for a decision variable with a positive value is 0. • Example Consider the following objective function: Min 2 x1 + 5 x2 + 4 x3 Suppose the optimal value of x1 is zero, with a reduced cost of 1.2. Since this is a minimization problem, this tells us that the current coefficient of x1 , which is 2, must be decreased by 1.2 in order for the optimal value of x1 to be nonzero. Thus if the objective function coefficient of x1 was 0.8 (or less), resolving the LP would yield a nonzero value of x1. Dr. C. Lightner Fayetteville State University
SLACK/SURLUS • The slack for “less than or equal to” constraints is the difference between the right hand side of an equation and the value of the left hand side after substituting the optimal values of the decision variables. • The slack represents the amount of unused units of the right hand side resources. • The surplus for “greater than or equal to” constraints is the difference between the right hand side of an equation and the value of the left hand side after substituting the optimal values of the decision variables. • The surplus represents the number of units in which the optimal solution causes the constraint to exceed the right hand side lower limit. Dr. C. Lightner Fayetteville State University
Par INC LINDO Solution LP OPTIMUM FOUND AT STEP 2 OBJECTIVE FUNCTION VALUE 1) 7667.942 VARIABLE VALUE REDUCED COST X1 539.9842530.000000 X2 252.0110320.000000 ROW SLACK OR DUAL PRICES SURPLUS 2) 0.000000 4.374566 3) 120.007088 0.000000 4) 0.000000 6.937804 5) 17.998819 0.000000 6) 539.984253 0.000000 7) 252.011032 0.000000 NO. ITERATIONS= 2 Constraint 1 Constraint 2 Constraint 3 Constraint 4 X1>=0 Constraint X2>=0 Constraint Dr. C. Lightner Fayetteville State University
Par INC LINDO Solution RANGES IN WHICH THE BASIS IS UNCHANGED: OBJ COEFFICIENT RANGES VARIABLE CURRENT ALLOWABLE ALLOWABLE COEF INCREASE DECREASE X1 10.000000 3.499325 3.700000 X2 9.000000 5.285714 2.333000 RIGHTHAND SIDE RANGES ROW CURRENT ALLOWABLE ALLOWABLE RHS INCREASE DECREASE 2 630.000000 52.358864 134.400009 3 600.000000 INFINITY 120.007088 4 708.000000 192.000000 127.986000 5 135.000000 INFINITY 17.998819 6 0.000000 539.984253 INFINITY 7 0.000000 252.011032 INFINITY Dr. C. Lightner Fayetteville State University
PAR INC • Recall that we rounded values (instead of entering fractions) when entering our model. Therefore, our LINDO output will be slightly different from the actual solution. • From the spreadsheet we see that the maximum that PAR can achieve while meeting the constraints is 7667.942 or 7668. • The optimal solution is to produce X1 =539.984253 or 540 standard bags, X2=252.011032 or 252 deluxe bags. • The reduced costs for both decision variables is zero since their optimal values are nonzero. • Row 1 represents the objective function. • Row 2 represents constraint 1, row 3 represents constraint 2, row 4 represents constraint 3, etc… • Refer to the order in which you entered the model into LINDO. Dr. C. Lightner Fayetteville State University
PAR INC (Slack/Surplus) • Constraint 1 is a “less than or equal to constraint” (0.7 x1+ x2 ≤630) Plugging the optimal values into the left hand side of constraint 1 gives 0.7(540) + 1 (252)2 = 630 Since the left hand side (with optimal values substituted) equals the left hand side, the slack is 0. • Constraint 2 is a “less than or equal to constraint” (0.5 x1+ 0.8333 x2 ≤600) Plugging the optimal values into the left hand side of constraint 2 gives 0.5 (540) + 0.8333(252) = 480 The difference between this value and 600 is 120. The spreadsheet lists 120 as the slack for this constraint. • Recall from LP Section 1that Constraint 2 represents the amount of sewing hours available for use. This slack indicates that the optimal solution leaves 120 sewing hours unused. Suggesting that less workers may be used to achieve the optima profit since so many hours will be wasted. Dr. C. Lightner Fayetteville State University
PAR INC (Slack/Surplus) • The output also reveals that 18 hours of Inspection and packing will also go unused. • The second output sheet gives information about sensitivity analysis. We will discuss this topic in the next section. Dr. C. Lightner Fayetteville State University
Floataway Tours LINDO Solution OBJECTIVE FUNCTION VALUE 1) 5040.000 VARIABLE VALUE REDUCED COST X1 28.000000 0.000000 X2 0.000000 2.000000 X3 0.000000 12.000000 X4 28.000000 0.000000 ROW SLACK OR SURPLUS DUAL PRICES 2) 0.000000 0.012000 3) 6.000000 0.000000 4) 0.000000 -2.000000 5) 52.000000 0.000000 6) 28.000000 0.000000 7) 0.000000 0.000000 8) 0.000000 0.000000 9) 28.000000 0.000000 Dr. C. Lightner Fayetteville State University
Floataway Tours LINDO Solution OBJ COEFFICIENT RANGES VARIABLE CURRENT ALLOWABLE ALLOWABLE COEF INCREASE DECREASE X1 70.000000 44.999996 1.875001 X2 80.000000 2.000001 INFINITY X3 50.000000 12.000001 INFINITY X4 110.000000 INFINITY 16.363636 RIGHTHAND SIDE RANGES ROW CURRENT ALLOWABLE ALLOWABLE RHS INCREASE DECREASE 2 420000.000000 INFINITY 45000.000000 3 50.000000 6.000000 INFINITY 4 0.000000 70.000000 30.000000 5 200.000000 52.000000 INFINITY 6 0.000000 28.000000 INFINITY 7 0.000000 0.000000 INFINITY 8 0.000000 0.000000 INFINITY 9 0.000000 28.000000 INFINITY Dr. C. Lightner Fayetteville State University
Floataway Tours LINDO Solution Discussion • The maximum daily profit that they can achieve (while meeting constraints) is $5040. • The optimal solution is x1=28 or purchase 28 Speedhawks and x2=28 or purchase 28 Classys. • The reduced costs for Speedhawks and Classys is 0 since their optimal values are nonzero. • The reduced cost for Silverbirds (x2) is 2. This means that the objective function coefficient for x2 (currently 80) must be improved by 2 in order for the optimal value of x2 to become nonzero (i.e. in order for it to become profitable to order Silverbirds). Since this is a maximization problem, improved means increased. Therefore if the daily expected profit for Silverbirds was 82 opposed to 80, it would be profitable to order Silverbirds. • Similarly if the objective function coefficient for Catmans (x3 ) was 62 (instead of 50) it would be profitable to order these type of boats. Dr. C. Lightner Fayetteville State University
Floataway Tours LINDO Solution Discussion • The surplus for constraint 2 (the requirement that at least 50 boats be purchased) shows that they purchase 6 boats over the 50 minimum requirement. • The surplus for constraint 4 ( the requirement that they have a seating capacity of at least 200) shows that they can seat 52 passengers over the 200 minimum requirement. Dr. C. Lightner Fayetteville State University
Police Scheduling LINDO Solution OBJECTIVE FUNCTION VALUE 1) 19.00000 VARIABLE VALUE REDUCED COST X1 0.000000 0.000000 X2 6.000000 0.000000 X3 4.000000 0.000000 X4 3.000000 0.000000 X5 1.000000 0.000000 X6 5.000000 0.000000 ROW SLACK OR SURPLUS DUAL PRICES 2) 0.000000 0.000000 3) 0.000000 -1.000000 4) 0.000000 0.000000 5) 0.000000 -1.000000 6) 0.000000 0.000000 7) 0.000000 -1.000000 Dr. C. Lightner Fayetteville State University
Police Scheduling LINDO Solution OBJ COEFFICIENT RANGES VARIABLE CURRENT ALLOWABLE ALLOWABLE COEF INCREASE DECREASE X1 1.000000 INFINITY 0.000000 X2 1.000000 0.000000 1.000000 X3 1.000000 0.000000 0.000000 X4 1.000000 0.000000 0.000000 X5 1.000000 0.000000 0.000000 X6 1.000000 0.000000 0.000000 RIGHTHAND SIDE RANGES ROW CURRENT ALLOWABLE ALLOWABLE RHS INCREASE DECREASE 2 5.000000 0.000000 3.000000 3 6.000000 INFINITY 0.000000 4 10.000000 0.000000 INFINITY 5 7.000000 INFINITY 0.000000 6 4.000000 0.000000 3.000000 7 6.000000 3.000000 0.000000 Dr. C. Lightner Fayetteville State University
Police Scheduling LINDO Solution • The department needs 19 officers to meet the daily requirements. • The optimal solution is to hire 0 officers to work the shift from 8AM – 4PM (x1=0), 6 officers to work the shift from Noon – 8PM (x2=6), 4 officers to work the shift from 4PM – Midnight (x3=4), 3 officers to work the shift from 8PM – 4AM (x4=3), 1 officers to work the shift from Midnight – 8AM (x5=1), and 5 officers to work the shift from 4AM – Noon (x6=5). • The surplus for all constraints is 0. Thus each shift has exactly the number of required officers for each shift. Dr. C. Lightner Fayetteville State University
THE END See your textbook for more examples and detailed explanations of all topics discussed in these notes. Dr. C. Lightner Fayetteville State University