Linear Programming
Linear Programming. ISQA 459/559. Getting Started with LP . Game problem Terms Algebraic & Graphical Illustration LP with Excel. Determining the Optimal Mix Strategy. Try multiple attempts with different scenarios OR Use Linear Programming (LP)


Linear Programming
E N D
Presentation Transcript
Linear Programming ISQA 459/559
Getting Started with LP • Game problem • Terms • Algebraic & Graphical Illustration • LP with Excel
Determining the Optimal Mix Strategy • Try multiple attempts with different scenarios OR • Use Linear Programming (LP) • You will need to install Solver on your laptop • In Excel: • Click Tools • Click Add-ins • Click Solver Add-in • We can use LP to address many production planning & distribution problems.
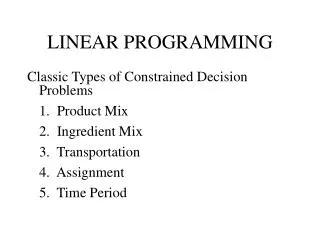
What is Linear Programming? • A sequence of steps that will lead to an optimal solution. • Used to • allocate scarce resources (shelf space) • assign workers • determine transportation schemes • solve blending problems (food, chemicals or portfolios) • solve many other types of problems
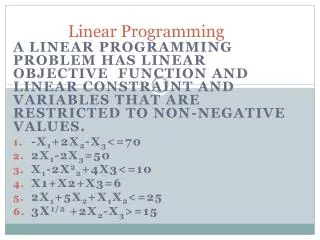
Five essential conditions: • Explicit Objective: What are we maximizing or minimizing? Usually profit, units, costs, labor hours, etc. • Limiting resources create constraints:workers, equipment, parts, budgets,etc. • Linearity (2 is twice as good as 1, if it takes 3 hours to make 1 part then it takes 6 hours to make 2 parts) • Homogeneity (each worker has an average productivity)
Bank Loan Processing • A credit checking company requires different processing times for consumer loans. • Housing loans (H) require 1 hour of credit review and 4 hours of appraising. Car loans (C) require 1 hour of credit review and 1 hour of appraising. • The credit reviewers have 200 hours available; the appraisers have 400 hours available. • Evaluating Housing loans yields $10 profit while evaluating Cars yields $5 profit. How many of each loan type should the company take?
Graphical Approach (2 variables) • Formulate the problem in mathematical equations • Plot all the Equations • Determine the area of feasibility • Maximizing problem: feasible area is on or below the lines • Minimization: feasible area is on or above the lines • Plot a few Profit line (Iso-profit) by setting profit equation = different values. • Answer point will be one of the corner points (most extreme)
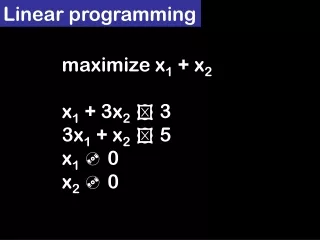
Equations • Maximize Profit : $10 H + $5 C • Constrained Resources • 1H + 1C < 200 (credit reviewing hours) • 4H + 1C < 400 (appraising hours) • H>0; C>0 (non-negative) • H= ? • C=?
Graphical Display C 400 4H + C < 400 300 200 10 H + 5 C 100 H + C < 200 100 200 300 400 H
Farmer Gail • Farmer Gail in Pendleton owns 45 acres of land. Gail is going to plant each acre with wheat or corn. Each acre planted with wheat yields $200 profit while corn yields $300. The labor and fertilizer needed for each acre given below. 100 workers and 120 tons of fertilizer are available.
Farmer’s Wheat and Corn Problem • Variables: • Acres planted in wheat = W • Acres planted in corn = C • Objective Function: • : Maximize profit $200 W + $300 C • Constraints: • Labor: 3 W + 2 C < 100 • Fertilizer: 2 W + 4 C < 120 • Land: 1W + 1 C < 45 • Non-Negativity: P1 & P2 > 0
Wheat & Corn Corn Wheat
Solver Set-up on Excel These 2 cells will change to find the solution. They represent W & C (our unknowns)
Note: The inequality signs are NOT typed in, they are an option
Answer Report What does slack mean here ?
Sensitivity Report Reduced cost: how much more profitable would W or C have to be to be included in the answer? Profit of Wheat could increase by $250 or decrease by $50 and we would still use plant 20 acres. If we could get another worker, each worker contributes $25 (shadow price) to profit for the range (100+20 =120) to (100 - 40=60) or between 60 and 120 workers. So, how much are we willing to pay for an extra worker? How much are we willing to pay for an extra ton of fertilizer? How much for an extra acre of land ?
Aggregate Planning Example Sailco
Sailco Corporation must determine how many sailboats to produce during each of the four next quarters. The demand during each of the four quarters is as follows: Q1: 40 sailboats Q2: 60 sailboats Q3: 75 sailboats Q4: 25 sailboats Sailco must meet demands on time. At the beginning of the first quarter, Sailco has an inventory of 10 sailboats. At the beginning of each quarter, Sailco must decide how many sailboats to produce during that quarter and we assume that sailboats manufactured during a quarter can be used to meet demand for that quarter. During each quarter, Sailco can produce up to 40 sailboats with regular-time labor at a cost of $400 per sailboat. By having employees work overtime during the quarter, Sailco can produce additional sailboats with overtime labor at a total cost of $450 per sailboat. At the end of each quarter (after production has occurred and the current quarter’s demand has been satisfied), a holding cost of $20 per sailboat is incurred. Determine a production schedule to minimize the sum of production cost and holding cost.
Sorting it out • What is the objective? • What are the variables? • What can be calculated? • What are the constraints?
Variables • Q1ProdReg, Q2ProdReg, Q3ProdReg, Q4ProdReg = the quantity of boats produced with regular production time. • Q1ProdOT, Q2ProdOT, Q3ProdOT, Q4ProdOT = the quantity of boats produced with overtime production time.