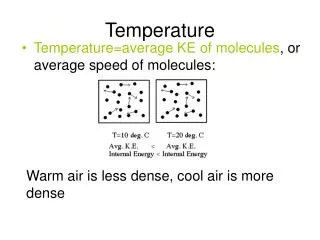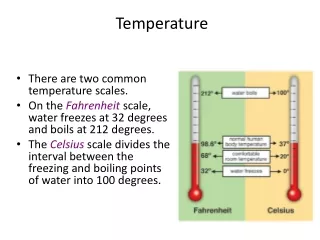
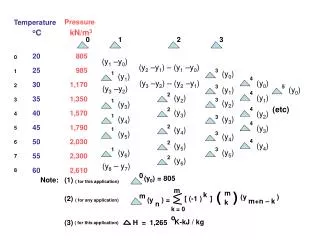
Pressure and Temperature Conversion Chart for Various Materials
This chart displays pressure and temperature conversion values in kN/m3 and oC for different materials. It includes specific readings and equations for accurate measurements and conversions.

Pressure and Temperature Conversion Chart for Various Materials
E N D
Presentation Transcript
Pressure Temperature oC kN/m3 0 1 2 3 20 805 0 (y1 –y0) (y2 –y1) – (y1 –y0) 25 985 3 1 (y0) 1 (y1) 4 (y3 –y2) – (y2 –y1) (y0) 30 1,170 2 3 5 (y3 –y2) (y1) (y0) 4 2 (y2) (y1) 35 1,350 3 3 1 (y2) (y3) (etc) 4 2 (y3) 40 1,570 (y2) 4 1 3 (y4) (y3) 4 45 1,790 2 (y3) 5 (y4) 1 (y5) 3 (y4) 50 2,030 4 6 2 (y5) (y4) 1 3 (y6) (y5) 55 2,300 7 2 (y6) (y8 – y7) 60 2,610 8 0 (y0) = 805 Note: (1) ( for this application) (y ) k m m+n – k ( ) m [ (-1 ) ] m (2) (y ) = ( for any application) k n k = 0 o K-kJ / kg (3) H = 1,265 ( for this application)