Download
1 / 20
200 likes | 351 Views
Feedback Control Roundup. Where is this class going? Why control? What is feedback? What are those block diagrams, and how do they relate to the equations? How does PID work? How do controllers go out of tune, how can I recognize them, and what do I do?. Where is this class going?.

E N D
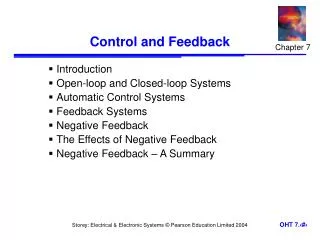
Where is this class going? • Why control? • What is feedback? • What are those block diagrams, and how do they relate to the equations? • How does PID work? • How do controllers go out of tune, how can I recognize them, and what do I do?
Where is this class going? • Things I want you to learn • “Assume steady state” does not work in real life. • Engineering is a synthesis of what you have learned, not a collection of separate topics • How to analyze and describe a dynamic system • How to understand control systems: • Anything called a “regulator” • Trade-offs in control design • How to save the day when the irresponsible control engineer goes on vacation
Where is this class going? • Content remaining • Control applications: feedforward, cascade, decoupling • Ways to analyze the effect of control on closed loop stability • Frequency domain analysis of dynamic systems • State space (very good for mechanical systems)
Why control? • We use control to: • Keep a value close to its desired value: • Room temperature, thermostat • Car speed, cruise control • Boiler drum level • Boiler fire-side pressure • Trade off variation between controlled and manipulated variables • Torque and position or speed • Flow and level in a surge tank • Temperature and heat stresses induced by heat
Where are we, as mechanical engineers, going to encounter control? • Any time something moves, that motion must be regulated. • Equipment: motors and guides • Fluids: flow rate, pressure and temperature • Control is implemented through mechanical equipment • Motors, valves, dampers • Limitations or faults in this equipment will affect control (and thus system) performance.
Disturbances - wind, slope, bad fuel Speed Error in km/h Actual Throttle Position Desired Throttle Position Desired speed in km/h Engine, Transmission, Wheels Cruise Control Throttle Actuator + - Speed in km/h Speed Sensor What is Feedback? • The controlled variable is measured. • It is then compared to a desired value, or setpoint. • The difference between setpoint and measurement is called the error. • The controller calculates a control output depending on the error. • The control output is sent to some physical equipment, a valve or similar, to affect the process. This physical equipment is called the Final Control Element. • The process responds to the change made by the final control element. • or 1. The process response is measured Speed
What are those block diagrams? • Block diagrams are a visual representation of the actual dynamic system and its governing equations. • Each line is a signal - something that varies over time, and can be measured or calculated. • Each block is a “functional element” - something that does something, and is governed by differential, integral or algebraic equations, and describable as a transfer function.
Disturbances - wind, slope, bad fuel Speed Error in km/h Actual Throttle Position Desired Throttle Position Desired speed in km/h Engine, Transmission, Wheels Speed Cruise Control Throttle Actuator + - Speed Sensor Speed in km/h Block Diagram
Standard Nomenclature • PV, or y : controlled variable • SP or ysp : setpoint, desired value • OP or u (text uses p): controller output • e : error, ysp - y • d or l : disturbance or load (wild) variable • ym : measured value of y • G : a transfer function • Gp : process transfer function • Gc : controller transfer function • Gv : final control element (valve) transfer function • Gm : measurement element transfer function • Gd or GL : Disturbance (Load) transfer function • Gcl : closed loop transfer function • K : transfer function gain • : time constant • : time delay (dead time) • : damping ratio (also called damping factor)
Block Diagram Disturbances - wind, slope, bad fuel d The purpose of the C.L.T.F. is to describe the entire system with a single transfer function that can be analyzed. Gd or GL Disturbance Process Speed Error in km/h Actual Throttle Position Desired Throttle Position Desired speed in km/h Gp Engine, Transmission, Wheels Speed Gc Cruise Control Gv Throttle Actuator y + ysp u e - ym Gm Speed Sensor Speed in km/h
Block Diagram Disturbances - wind, slope, bad fuel d Closed Loop System Gd or GL Disturbance Process Closed Loop Disturbance Transfer Function Speed Error in km/h Actual Throttle Position Desired Throttle Position Desired speed in km/h Closed Loop Setpoint Transfer Function Engine, Transmission, Wheels Gp Speed Cruise Control Gc Throttle Actuator Gv y + ysp u e - ym Gm Speed Sensor Speed in km/h
Block Diagram • y = Gd * d + Gp * Gv * u • = Gd * d + Gp * Gv * Gc * e • = Gd * d + Gp * Gv * Gc * (ysp - ym) • = Gd * d + Gp * Gv * Gc * (ysp - Gm * y) • = Gd * d + Gp * Gv * Gc * ysp - Gp * Gv * Gc * Gm * y • y + Gp * Gv * Gc * Gm * y = Gd * d + Gp * Gv * Gc * ysp • y ( 1 + Gp * Gv * Gc * Gm) = Gd * d + Gp * Gv * Gc * ysp • y = (Gd/(1 + Gp Gv Gc Gm)) * d + ( Gp Gv Gv/(1 + Gp Gv Gc Gm)) * ysp • These rules are applied around the block diagram: • y = Gd * d + Gp * Gv * u • u = Gc * e • e = ysp - ym • ym = Gm * y • The block diagram is used to figure out the governing equations directly. • Each transfer function is multiplied by its input to get its output: • u = Gc * e • ym = Gm * y • Summers (circle with x inside) add inputs, or, if the input is marked with a - sign, that input is subtracted • e = ysp - ym Disturbances - wind, slope, bad fuel d Gd or GL Speed Error in km/h Actual Throttle Position Desired Throttle Position Desired speed in km/h Speed Engine, Transmission, Wheels Gp Gc Cruise Control Throttle Actuator Gv y + ysp u e - ym Gm Speed in km/h
Block Diagram Disturbances - wind, slope, bad fuel d Closed Loop System Closed Loop Disturbance Transfer Function Gd 1 + Gp Gv Gc Gm Gd or GL Speed Error in km/h Actual Throttle Position Desired Throttle Position Desired speed in km/h Speed Closed Loop Setpoint Transfer Function Gp Gv Gc 1 + Gp Gv Gc Gm Gp Engine, Transmission, Wheels Cruise Control Gc Throttle Actuator Gv y + ysp u e - ym Gm Speed in km/h
How does PID work? • PID control acts on the error. • The control action is the sum of three terms: • Proportional: Kc * the error now • Integral: Kc/TauI * the integral of error since the controller was turned on • Derivative: Kc*TauD * the rate of change of the error now
Comments • P never reaches setpoint. • PID responds before PI does because of the Derivative term.