Download
1 / 4
40 likes | 213 Views
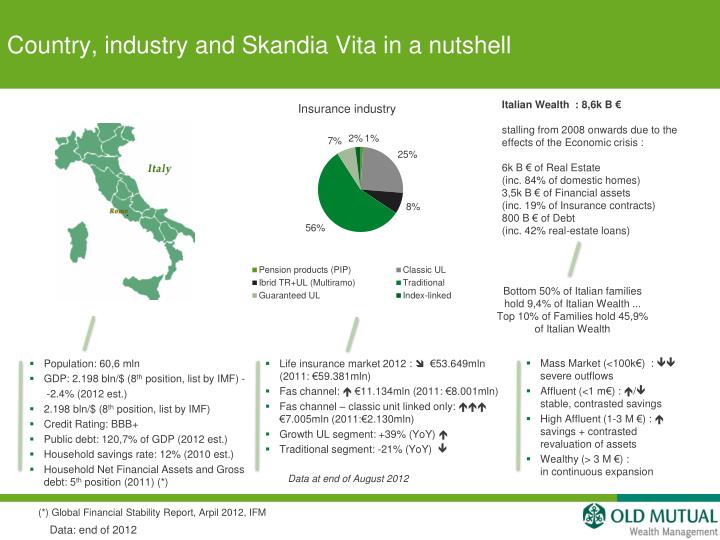
Country, industry and Skandia Vita in a nutshell. Insurance industry. Italian Wealth : 8,6k B € stalling from 2008 onwards due to the effects of the Economic crisis : 6k B € of Real Estate (inc. 84 % of domestic homes ) 3,5k B € of Financial assets (inc. 19% of Insurance contracts)

E N D
Country, industry and Skandia Vita in a nutshell Insurance industry Italian Wealth : 8,6k B € stalling from 2008 onwards due to the effects of the Economic crisis : 6k B € of Real Estate (inc. 84% of domestic homes) 3,5k B € of Financial assets (inc. 19% of Insurance contracts) 800 B € of Debt (inc. 42% real-estate loans) Bottom 50% of Italian families hold 9,4% of Italian Wealth ... Top 10% of Families hold 45,9% of Italian Wealth • Mass Market (<100k€) : severe outflows • Affluent (<1 m€) : / stable, contrasted savings • High Affluent (1-3 M €) : savings + contrasted revaluation of assets • Wealthy (> 3 M €) : in continuous expansion • Population: 60,6 mln • GDP: 2.198 bln/$ (8th position, list by IMF) - • -2.4% (2012 est.) • 2.198 bln/$ (8th position, list by IMF) • Credit Rating: BBB+ • Public debt: 120,7% of GDP (2012 est.) • Household savings rate: 12% (2010 est.) • Household Net Financial Assets and Gross debt: 5th position (2011) (*) • Life insurance market 2012 : €53.649mln (2011: €59.381mln) • Fas channel: €11.134mln (2011: €8.001mln) • Fas channel – classic unit linked only: €7.005mln (2011:€2.130mln) • Growth UL segment: +39% (YoY) • Traditional segment: -21% (YoY) Data at end of August 2012 (*) Global Financial Stability Report, Arpil 2012, IFM Data: end of 2012
Skandia Vita on the Italian landscape Italian Market: sales split per type and distribution channel (2011) (*) Skandia Vita TraditionalCompetition • provide a complete range of products, but not a real and continuous product innovation • exploiting different business models (captive networks, agreements or JV): they penetrate in all the networks with a tailor-made offer • potentially affected by conflicts of interests • strong brand awareness • unique and sophisticated product requiring a high-level advice and financial culture • operating model through distribution agreements thus maintaining an independent touch (i.e. such a model is quite unique on the market) • independence ensures no conflicts of interest • low brand awareness among end-clients, leverage on our partner’s brands in Italy • Italian Company registered in 1997 • Nr. of employees: 110 • AuM: 4,5 bln/€ (2012) • Nr. of clients: 52.500 • Traditional Life : 0 %, UL : 100% • UL market share: 8% • UL Fas market share: 15% (*) Source: IAMA (**) Data are not referred to the whole Group, but only to the companies within each Group considered as direct competitors of Skandia, both for product range and distribution model
Skandia Vita business model: positioning evolution • From inception till 2001, our offer was focused on a very simple unit linked product (i.e. in-house funds wrapping bank bonds) distributed mainly through small/medium local banks • Since 2001 the first Fas partnerships have emerged and since then FAs have become the primary distribution channel • In 2005 theguided open architecture platform has been launched . Since then, dynamic investment solutions, requiring high-level financial culture and targeting mostly FAs networks have become our main and most successful Distribution Channel. • Small – medium size banks, usually regional structured • Target customers: 75K to 100K • Current AuM: 300 mln/€ • Current nr. of Banks: 15 • Financial advisors network • Customers: 100K up to 1 mln • Current nr. of Fas potentially able to sell Skandia products: 12.000 • Private Bankers • Customers: over 1 mln • Current AuM: 400 mln/€ guided architecture selected open architecture open architecture
Market structure and key factors of Success (Skandia) Domestic market structure Our model of business Banking groups Financial Advisors (Fas) • How we operate: • We are not fund managers • We are fund selectors • We do not distribute directly • We distribute through agreements with high standing partners 3 types of partnerships: Financial Advisors Networks Retail Banking Private Banking • Not employees, but work on commission • Historically, FAs have been forced to promote in-house products, today they are pressing to offer third party products • In direct competition with Private Banks Distribution channels Products’ factories FAs’ network Retail banking Private banking Asset Mgmt Insurance Sales structure Bancassurance agreements Exclusive agreements • Complete range of products, but poor innovation • Tailor –made solutions, for segments of clients through specif channels • Affected by conficf of interests • Clients are loyal to their Fas not to the bank • Local presence • Global capabilities Part of an International Group Key success factors: • Funds and asset managers’ election • Regular monitoring on fund range Strong Financial Expertise Local independence • Additional features: Stop Loss and Dollar Cost Averaging • Skandia Daily Trading High-qualityProduct Provider • Tailor-made solutions from a distributor’s perspective • Freedom of choice Flexible “Perceived” flexibility • Capturing market needs • Quick products adjustments Fast • Insight reporting on our portfolio • Dedicated infoline and extranet area High-quality Service Provider “Low cost” innovation • Implementation of automatic tools (front end) • User friendly monitoring tools Efficient • New investment proposal (funds and asset managers) • New products features (Stop Loss and PPI) Innovative